Objective: To graph functions that are the sums or differences of two sine functions, two cosine functions, or a sine and a cosine function.
"The function y = 2x + 4 is actually the sum of two functions, y = 2x and y = 4. For every value in the domain, there is a corresponding value in the range so that the point (x, 2x + 4) is on the graph of y = 2x + 4. The sums of trigonometric functions can also be graphed."
Resource: Hayden, Jerome D. and Hall, Bettye C. (1993). Trigonometry. Prentice Hall: Englewood Cliffs, New Jersey.
I. Graphing by addition of ordinates on Graphing Calculator.
1. Graph y = sinx over the interval [-2p, 2p]. Then, on the same coordinate plane (but in a different color), graph y = cosx over the same interval. Finally, on the same coordinate plane (but in a different color), graph y = sinx + cosx over the same interval. For each value in the domain, how do the values of the range of y = sinx + cosx compare with the values of the ranges of y = sinx and y = cosx?
2. Graph y = 2cosx over the interval [-2p, 2p]. Then, on the same coordinate plane (but in a different color), graph y = cos2x over the same interval. Finally, on the same coordinate plane (but in a different color), graph y = 2cosx + cos2x over the same interval. For each value in the domain, how do the values of the range of y = 2cosx + cos2x compare with the values of the ranges of y = 2cosx and y = cos2x?
II. Graphing by addition of ordinates by hand.
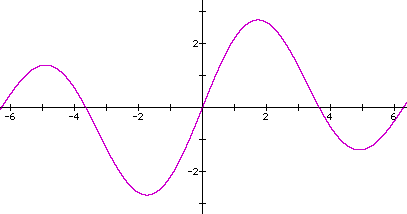
1. Open an Excel file. Label the first column "x-coordinates," the second column "y = 2sinx," the third column "y = -sin0.5x," and the fourth column "y = 2sinx - sin0.5x." Set each column to round to four decimal places.
2. Set up the first column to range from -2p to 2p by intervals of p/4.
3. Fill in the second and third columns by utilizing the equations y = 2sinx and y =0.5sinx, respectively.
4. Fill in the fourth column by simply adding the second and third columns.
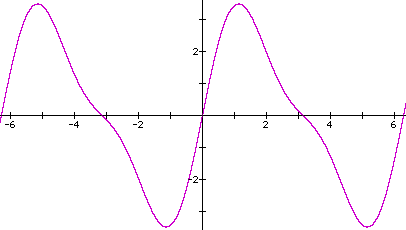
5. Graph y = 2sinx + sin0.5x by using the x-coordinates from column A and the y-coordinates from column D.
I.
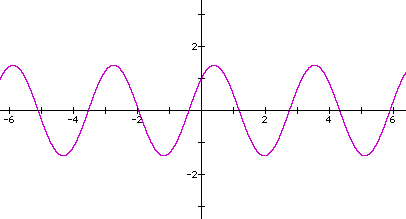
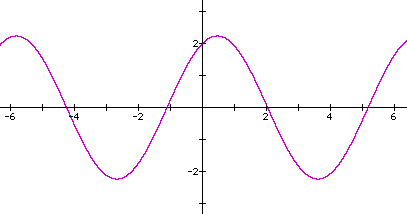
1. y = sinx is in red, y = cosx is in blue, and y = sinx + cosx is in purple
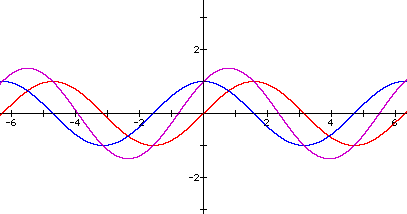
Answer: At each x-coordinate, the y-coordinates of y = sinx + cosx is the sum of the y-coordinates of y = sinx and y = cosx.
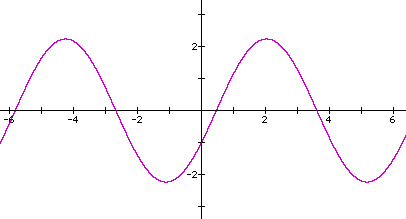
2. y = 2cosx is in red, y = cos2x is in blue, and y = 2cosx + cos2x is in purple
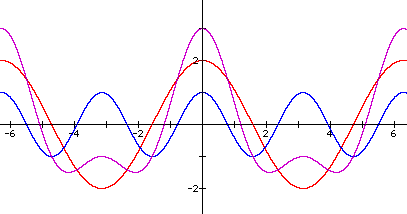
Answer: At each x-coordinate, the y-coordinates of y = sinx + cosx is the sum of the y-coordinates of y = sinx and y = cosx.
II.
2. In cell A2, enter "=-2*pi()". In cell A3, enter "=A2+pi()/4". Drag to fill down to row 18.
3. In cell B2, enter "=2*sin(A2)". Drag to fill down to row 18. In cell C2, enter "=-1*sin(A2/2)". Drag to fill down to row 18.
4. In cell D2, enter "=B2+C2". Drag to fill down to row 18.
Here is a sample table:
|
|
|
|
|
| -6.2832 | 0 | 0 | 0 |
| -5.4978 | 1.4142 | 0.3827 | 1.7969 |
| -4.7124 | 2 | 0.7071 | 2.7071 |
| -3.9270 | 1.4142 | 0.9239 | 2.3381 |
| -3.1416 | 0 | 1 | 1 |
| -2.3562 | -1.4142 | 0.9239 | -0.4903 |
| -1.5708 | -2 | 0.7071 | -1.2929 |
| -0.7854 | -1.4142 | 0.3827 | -1.0315 |
| 0 | 0 | 0 | 0 |
| 0.7854 | 1.4142 | -0.3827 | 1.0315 |
| 1.5708 | 2 | -0.7071 | 1.2929 |
| 2.3562 | 1.4142 | -0.9239 | 0.4903 |
| 3.1416 | 0 | -1 | -1 |
| 3.9270 | -1.4142 | -0.9239 | -2.3381 |
| 4.7124 | -2 | -0.7071 | -2.7071 |
| 5.4978 | -1.4142 | -0.3827 | -1.7969 |
| 6.2832 | 0 | 0 | 0 |
5. Here is a sample graph:
Graph each of the following functions (by hand!) over the interval [-2p, 2p].
1. y = sinx + 2cosx
2. y = 3sinx + sin2x
3. y = 2sinx - cosx
4. y = cos2x + sin2x
1.
2.
3.
4.