

This is the write-up for assignment 11.
In this write-up we will be investigating polar
equations. Click here
for a quick review of the polar coordinate system.
Let's consider the equation  and take a look at several graphs while
we let the b value remain constant and let the k value
vary. We only look at k values that are positive integers.


Equations of the form  , where b is a constant and k
is a positive integer, produce graphs called roses.
The radius of the rose is determined by the
coefficient b in  .
.
We can see that the k value effects the number of petals in the rose. If the k value is odd, there will be exactly k petals. If the k value is even, there will be exactly 2k petals. (In the examples, the k value was always an integer. If k is not an integer, then a complete petal will not be formed.)
Click here for a dynamic presentation in which the b value remains constant (b=1) and the k value varies from -10 to 10.
Now, let's take a look at the equation:

Let k=1 and vary the a and b values ( but we will keep a=b ) in the equation.


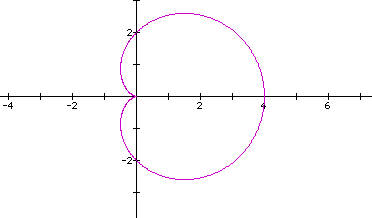
When a=b in the equation  and k=1, we
get graphs that are called cardiods.
Now, if we let a and b be different numbers and keep k=1, we get the sample graphs below:

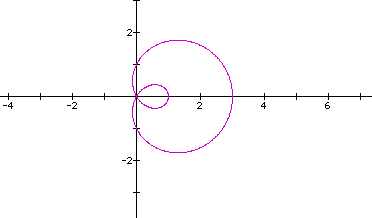

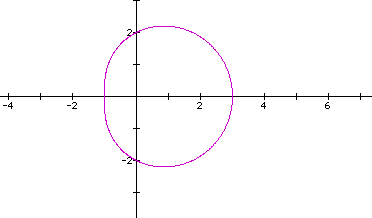

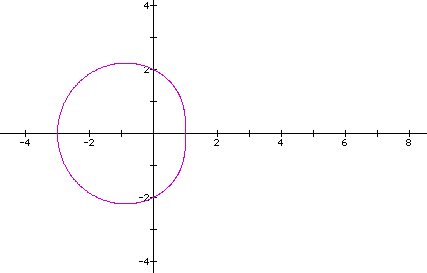

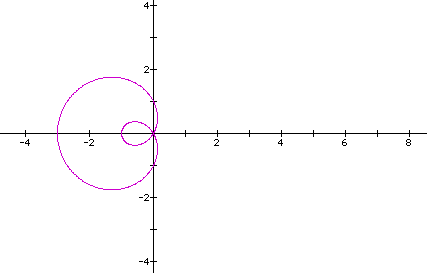
All of the graphs above are called limacons.
Some of the graphs above had inner loops. These are called limacons with an inner loop.
The limacon  has an inner loop. A close look at the graph and the
equation reveals that these loops correspond to negative values
of r. For
  , we
have r=0 when
  =
= /3 or 5
 /3, and
r<0 for  /3 <
/3 <  <
5
<
5 /3. For these
 values the curve
is drawn on the opposite side of the origin or pole.
These graphs also have symmetry with respect
to the x-axis. This symmetry occurs because the cosine function
is an even function ( i.e. for any  , cos
, cos =cos
(-
 ) ).
) ).
If we were to replace the above equations with the sine function, we would obtain basically the same type graph, except the graph would be symmetric with respect to the y-axis, because the sine function is odd.
Below are some graphs of the above equation letting a=1 and b=1 and varying the k value.


Click here
for a dynamic presentation of the graph of  where the value of k varies from -10
to 10.
So, when a and b are both the same value in
the equation  and
we vary the k value (positive integer values only), we still obtain
a curve that that resembles a rose. The number of petals on the
rose is equal to k. This is different when k was
an even integer in the equation
  .
.
Now, let's take a look at how the a and
b values effect the equation of  . In the previous examples above, we
let a=1 and b=1. (Notice that in all of the examples,
the petal has a maximum length of 2). Now, if we let the a
and the b value vary (keeping both the same value)
and let the k value a remain a constant we can see from the examples
below that the length of the petal will depend on the value of
a and b.


We can see from the examples above that the
lengths of the petals got longer as we increased the values of
a and b (keeping a and b the same
value).