
This write-up is an exploration of the curves
![]() and
and ![]() using Graphing Calculator
2.7.1.
using Graphing Calculator
2.7.1.
Let's first take a look at how the "a"
value in ![]() effects the graph. The following
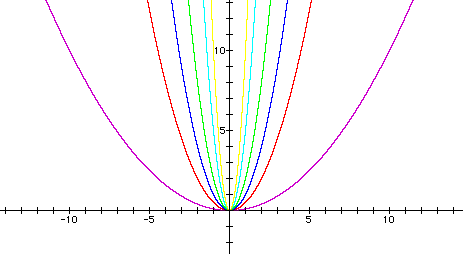
are graphs with the "a" value of .1, .5,
1, 2, 5, 10.
effects the graph. The following
are graphs with the "a" value of .1, .5,
1, 2, 5, 10.
a=.1 purple graph : a=.5 red graph : a=1 blue graph : a=2 green graph : a=5 lt.blue graph : a=10 yellow graph

We can see from these examples that the "a" value is definitely either narrowing or expanding the graph depending upon the value of a. As the value of "a" gets larger the graph gets narrower. As the value of "a" decreases to zero the graph expands toward the x-axis.
Question: What do you think negative values of "a" will do to the graph? Click here for the answer.
Now let's take a look at how
the value of "d" effects the graph of ![]() . The following are graphs with the "d"
value of -10, -5, -3, -2, -1,
0, 2, 3, 5, 10.
. The following are graphs with the "d"
value of -10, -5, -3, -2, -1,
0, 2, 3, 5, 10.

We can see the the "d"
value effects the graph of ![]() in the graphs above
by shifting the graph of
in the graphs above
by shifting the graph of ![]()
either right or left depending upon the value of "d." Click here for a better presentation of the translation of the graph.
The value of "a" in ![]() dialates the graph. If |a| is greater
than 1, then the graph will get narrower toward the y-axis. If
|a| is between 0 and 1, then the graph will expand toward
the x-axis.
dialates the graph. If |a| is greater
than 1, then the graph will get narrower toward the y-axis. If
|a| is between 0 and 1, then the graph will expand toward
the x-axis.
The value of "d"
in ![]() translates the graph of
translates the graph of ![]() .
If "d" is a positive value, the graph
will shift to the right "d" units. If the "d"
value is negative, then the graph will shift to the left |d|
units.
.
If "d" is a positive value, the graph
will shift to the right "d" units. If the "d"
value is negative, then the graph will shift to the left |d|
units.