
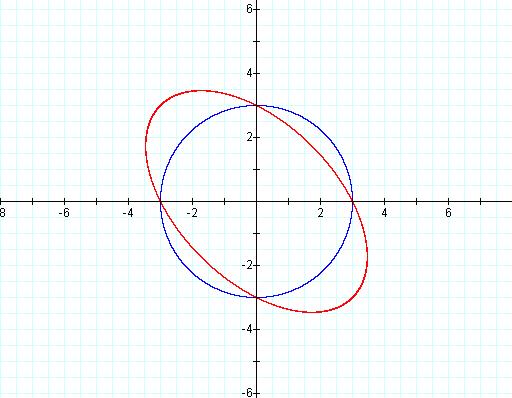
Then on the same axis we are asked to graph:
Click here for a little
movie to see how the graph will change.
What do you notice about the shape as n gets close to 2?
Is it still an ellipse?
As we begin to vary n from zero to three we can see the circle begin to flatten out to an ellipse and then when n = 2 we will see two parallel lines as the ends of the ellipse go out to infinity. As n passes 2 then the graph begins to take on a new shape. It begins to look like a hyperbola.
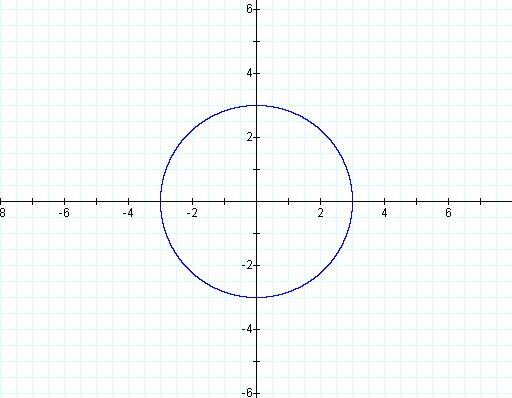
The Red circle
is given by the quation: ![]() .
.
The parallel Purple lines are given by the equation: ![]() .
.
The Blue
graph is the hyperbola given by the
equation: ![]()
Just by changing the coefficent of the middle term we can create very different graphs. A great way to see them all is by the three-dimensional graph. Remember that we just looked at one slice of this surface.