Write-up # 11
Exploring Polar Equations: Rose Curves
by
Holly Anthony
Problem: Investigate the following equations varying a, k, and b.
You can move through the investigation linearly or you may choose to skip around using the links below.
Let's begin by investigating:
simultaneously.
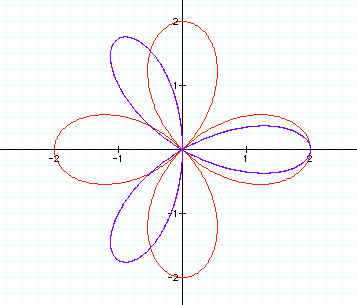
When a = 1 and k = 1, the polar equations will produce the following graph where the sine equation is in blue and the cosine equation is in red.
At this point, we can see that the circular shape has a center at 1 on the polar scale. The sine equation is symmetric about the y-axis and the cosine equation is symmetric about the x-axis.
I will explore the following facets of these equations. (You may proceed through this exploration linearly or skip to various sections if you wish)
Varying 'a' in the Sine Equation
Varying 'a' in the Cosine Equation
Varying 'k' in the Sine Equation
Varying 'k' in the Cosine Equation
If we first allow 'a' to vary, we can observe the following situations.
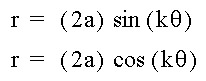
Varying 'a' in the sine equation
In the following graph we let k=1 and vary 'a'.
|
a = 1
|
purple
|
|
a = 2
|
red
|
|
a = 3
|
blue
|
|
a = -1
|
green
|
|
a = -2
|
teal
|
We can see that the sine equation remains symmetrical about the y-axis. However, since 'a' is multiplied by two, by increasing 'a' we expand the graph by two each time. When 'a' is negative, the graph is reflected about the x-axis.
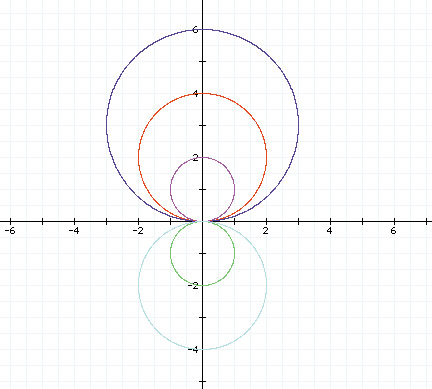
Varying 'a' in the cosine equation
In the following graph, we let k = 1 and vary 'a'.
|
a = 1
|
purple
|
|
a = 2
|
red
|
|
a = 3
|
blue
|
|
a = -1
|
green
|
|
a = -2
|
teal
|
We can see that the cosine equation remains symmetrical about the x-axis. However, since 'a' is multiplied by two, by increasing 'a' we expand the graph by two each time just as with the sine equation. When 'a' is negative, the graph is reflected about the y-axis. I conclude:
Now, let's examine the sine and cosine equations to see what happens when we vary 'k'.
Varying 'k' in the Sine Equation
In the following graph, let a = 1 and vary 'k'.
Let's look at various graphs.
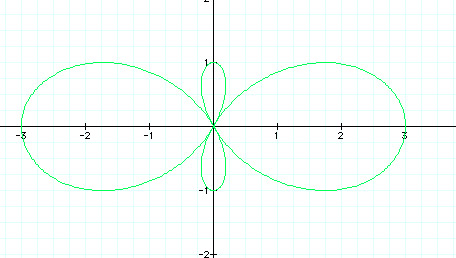
When a =1 and k = 2.
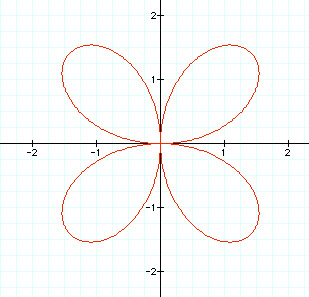
When k > 1, the sine equation no longer has a circular shape. It now appears to have petals. We notice that when k = 2, the graph has 4 petals. Can we assume the the number of petals is 2 times k? Let's look at another graph.
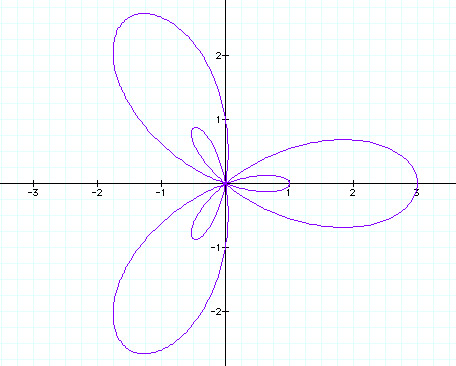
When a = 1 and k = 3.
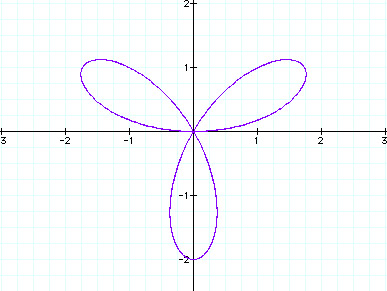
In this graph, k = 3 and we have 3 petals, not 2 times k or 6. What is happening? Let's look at a few more cases.
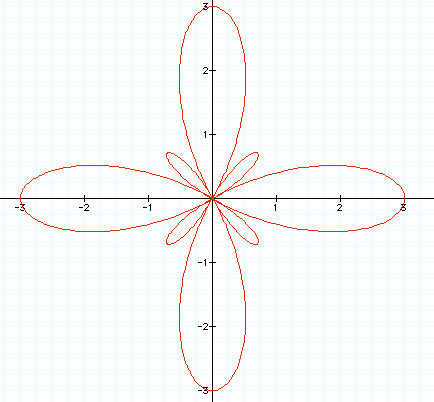
When a = 1 and k = 4
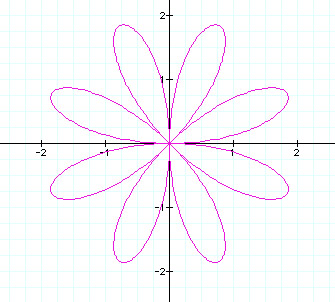
In this graph, k = 4 and we have 8 petals, which is 2 times k. This is the same as when k = 2. Let's examine one more graph and then make some conclusions.
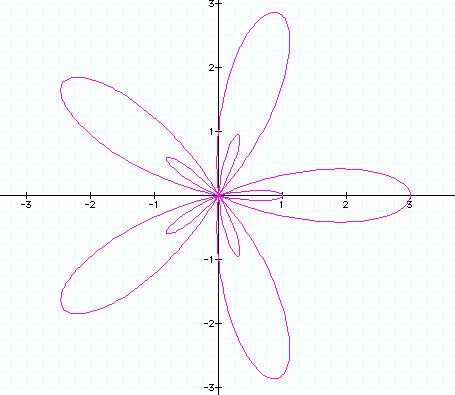
When a = 1 and k = 5
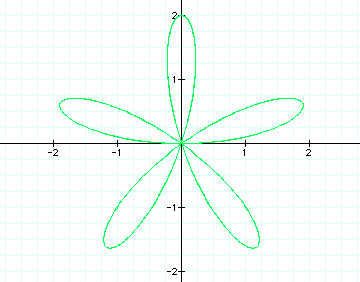
In this graph, k = 5 and we have 5 petals, which is the same as when k = 3 and we had 3 petals.
After examining several more graphs, I conclude:
Varying 'k' in the Cosine Equation
In the following graph, let a = 1 and vary 'k'.
Let's look at various graphs.
When a =1 and k = 2 in red and k = 3 in blue.
We see in the graph that when k = 2, the graph has 4 petals (2 times k) and that when k = 3, the graph has 3 petals ( k = # of petals). After examining several cosine graphs varying k, I conclude:
This holds with our conclusions from investigating the sine equations.
Now, let's investigate the equations with the addition of 'b'.
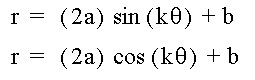
simultaneously while varying a, k, and b.
When a = 1,k = 1, and b = 1 the polar equations will produce the following graph where the sine equation is in blue and the cosine equation is in red.
The graph of these equations has a shape distinctly different from the circular shape and the petal shape we have observed before. We now appear to have a loop with a smaller loop inside. The sine equation is still symmetric about the y-axis and the cosine equation is symmetric about the x-axis.
I will explore the following facets of these equations. (You may proceed through this exploration linearly or skip to various sections if you wish)
Varying 'a' in the Sine and Cosine Equation
Varying 'k' in the Sine and Cosine Equation
Varying 'b' in the Sine and Cosine Equation
Varying 'a' in the Sine and Cosine Equation
For investigation purposes, we will notice that our explorations may be using the sine equation(blue) or the cosine equation (red), but since these curves act similarly, our conclusions will be for both.
When k = 1 and b = 1, we can vary 'a' in the sine equation.
When a = 2 in blue and a = 3 in purple.
We see that varying 'a' changes the graph in the same way as when our equations did not have the addition of the variable 'b'. As 'a' increases the graph expands in size. When a is negative, the sine equation is reflected about the x-axis and the cosine equation is reflected about the y-axis.
Varying 'k' in the Sine and Cosine Equation
For investigation purposes, we will notice that our explorations may be using the sine equation(blue) or the cosine equation (red), but since these curves act similarly, our conclusions will be for both.
When a = 1 and b = 1, we can vary 'k' in the cosine equation.
When k = 2 in green.
We can see in the graph that when k = 2, we appear to get four petals ( 2 times k). Two large petals and two small petals. Will the conclusion we made earlier hold true for these new equations? When k is even, will we get 2k petals? When k is odd, will we get k petals? Let's look at some more graphs and then make some conclusions.
When k = 3 in blue.
Looking at this graph, when k =3 we appear to get 3 petals with 3 petals inside. Does this still fit our conclusion that when k is odd, we get k petals? We may need to refine our conclusions! Let's continue to investigate.
When k = 4 in red.
Again, when k is even, in this case k = 4, we get 8 petals (2K): two large and two small. We'll look at one more graph before making our conclusions.
When k = 5 in purple.
Just like when k =3 and we had 3 large petals with 3 small petals inside, this time when k =5, we have 5 large petals with 5 small petals inside. From these investigations, I conclude:
Varying 'b' in the Sine and Cosine Equations
For investigation purposes, we will notice that our explorations may be using the sine equation(blue) or the cosine equation (red), but since these curves act similarly, our conclusions will be for both.
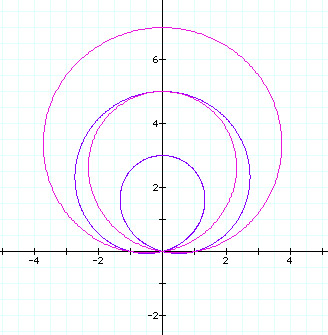
When a= 1 and k= 1, we can vary 'b' in the sine equation.
When k = 2 in blue, k = 3 in green, k = 4 in red, k = 5 in purple.
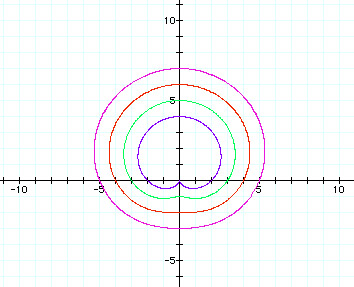
We see from the above graph that as b increases, the graph expands in size and appears to be approaching a circle or ellipse like shape.
To explore this further, open Graphing Calculator 3.1 and click here.