Polar Equations
by
Summer Brown
On this page, you will find investigations
of the graph of:
I will be exploring the graphs of the
above equation when a and b are equal and k is any integer.
Click here to view examples where a and b are not equal.
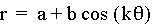
Let's begin with a=b=1. Below are graphs
when k = 0,
1, 2.
When k
= 0, the graph is a circle with a
radius of 2.
When k
= 1, the graph forms one "leaf."
I will denote the length of a leaf by the distance from the origin
to the farthest point from the origin on the leaf. In this example,
the length of the leaf is 2 units.
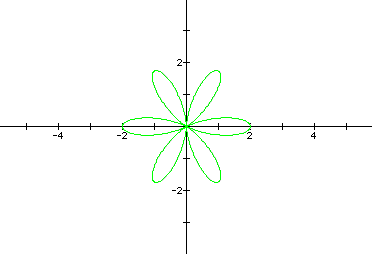
When k
= 2, the graph forms two leaves,
each with a length of 2 units.
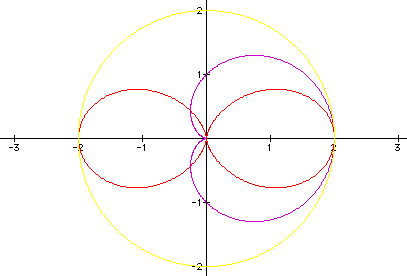
Let's look at some more examples when
k = 3,
4, 5.
When k
= 3, the graph forms 3 leaves, each
with a length of 2 units.
When k
= 4, the graph forms 4 leaves, each
with a length of 2 units.
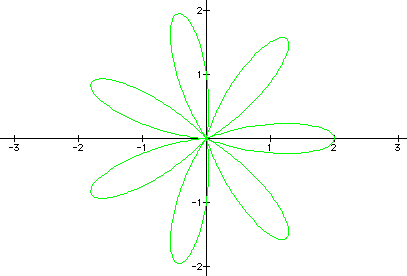
When k
= 5, the graph forms 5 leaves, each
with a length of 2 units.
We can begin to make some conjectures
about the graphs of the polar equation  .
.
- The graph forms k leaves of a "rose."
- The length of each leaf is equal to
a + b or 2a. Cases where a and b are not equal can be used to
disprove that the length of each leaf is 2a. Click here to see these
counterexamples, where a and b are not equal. Thus, the length
of each leaf is a + b. (This will be modified later when negative
values of a and b are considered.)
- The leaves are equally spaced apart,
with each leaf rotated by
 radians.
- When k is even, the graph is symmetric
with respect to both the x-axis and the y-axis.
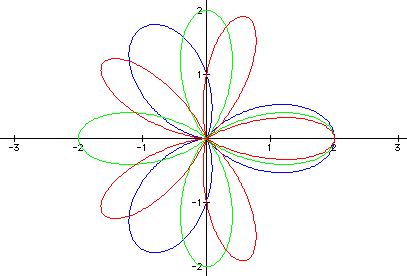
What about negative values of k? Take
a look at the examples below to conclude that negative values
of k produce the same graph as positive values of k. Below are
examples when k = 7
and -7.
View an animation
of the graph of , where a,b =1 and
k varies between -10 and 10. Negative values of k produce the
same graph as their positive counterparts.
What happens if we change the values
of a and b?
Below are examples of graphs when k
= 3 and a,b = 1,
2, and
3.
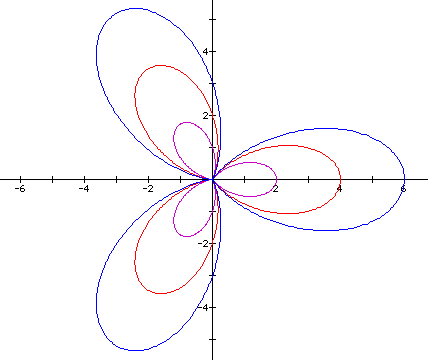
As a and b increase, the leaves of the
rose stretch our further. In each case, the length of each leaf
is equal to a + b. If we compare the above graphs to the graphs
when a,b = -1,
-2,
and -3
; we see that the orientation of the graph is reversed (at least
when k=3.)
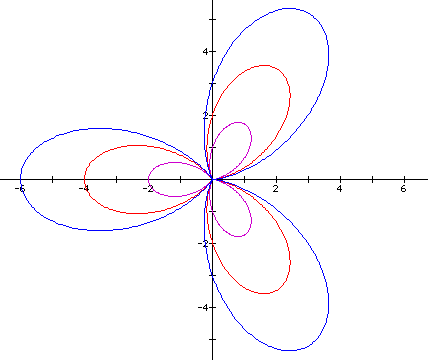
One leaf now lies on the negative side
of the x-axis instead of the positive side. In other words, the
graph has been rotated by  radians. Yet another
way to describe the difference is to say that the graph has been
reflected over the y-axis. Also, we need to modify our conjecture
that the length of a leaf is a + b. The length is in fact,
radians. Yet another
way to describe the difference is to say that the graph has been
reflected over the y-axis. Also, we need to modify our conjecture
that the length of a leaf is a + b. The length is in fact,  .
.
If we look at more examples of the graphs
comparing a,b with -a,-b, we discover two cases. The first is
when k is odd. The graph is reflected over the y-axis. An example
of this case was shown above where k=3.
The second case is when k is even. The
graph does not change when the values of a and b change signs.
The negative values produce the same graphs as the positive values.
An example of this is illustrated below where k=6. You see only
one graph, because the negative values of a and b produce the
same graph as the positives. This makes sense, because, if we
tried to reflect the graph over the y-axis, we would obtain the
same graph. This will hold true for all cases where k is even,
because there are an even number of leaves, thus making the graph
symmetric across the y-axis.
To summarize my findings:
- k designates the number of leaves of
the rose
- The length of each leaf is equal to
- The leaves are equally spaced apart
around 2 radians, with an angle of radians between each leaf
- When k is even, the graph is symmetric
with respect to the x-axis and to the y-axis
- When k is odd, the graph is symmetric
with respect to the x-axis only
- When k is odd, negative values of a
and b reflect the graph across the y-axis