Assignment #2
Exploring graphs of
the parabola

by
Summer D. Brown
In this write-up, I will investigate
and discuss what happens when two of the values for a, b, and
c are fixed and the third varies.
Let's start by varying a and
fixing b and c.
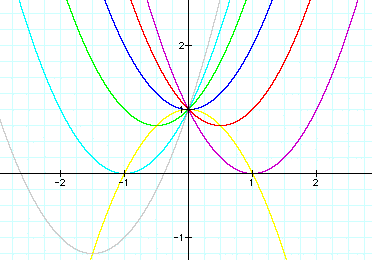
Let b = 1 and c = 1. Examine
the following graphs...
 |
Purple
|
 |
Red
|
 |
Blue
|
 |
Gray
|
 |
Green
|
 |
Aqua
|

There are several comments
I would like to make about the above graphs and what occurs as
the value of a changes.
First, it is rather obvious
that when a is positive, the parabola faces upwards. When a is
negative, the parabola faces down.
Second, in every case, the
parabola passes through the point (0,1). In fact, by exploring
different fixed values for c, one can observe that the parabola
will always pass through the point (0,c). Click here to change the value of c in Graphing
Calculator.
The parabola always remains tangent to the
line y = x + 1 at the point (0,1). To generalize, the parabola
will always remain tangent to the line y = x + c at the point
(0,c).
Third, you will notice that the vertex of
the parabola changes as a changes. As a approaches +/- infinity,
the vertex of the parabola approaches (0,c). The parabola becomes
more "skinny." Also, the parabola widens as the absolute
value of a gets smaller, i.e., as a approaches 0. When a is 0,
the parabola degenerates into a line corresponding to the equation
y = bx + c.
If you were to trace the path of the vertex
of the parabola as a changes, you would form a straight line.
This line is shown below in yellow.

The y-intercept of this line is at (0,1).
One can calculate the slope of the line by using two coordinates
of two parabola's vertices. In this example, with b=1 and c=1,
the equation for the yellow line is:

By exploring other fixed values of b and c,
one comes to the conclusion that as a changes, the vertices of
the parabolas will move along the line:

Now let's explore what happens as we vary
the value of b, and fix the values of a and c.
Let a = 1 and c = 1. Examine the following
graphs...
 |
Purple
|
 |
Red
|
 |
Blue
|
 |
Green
|
 |
Aqua
|
 |
Gray
|

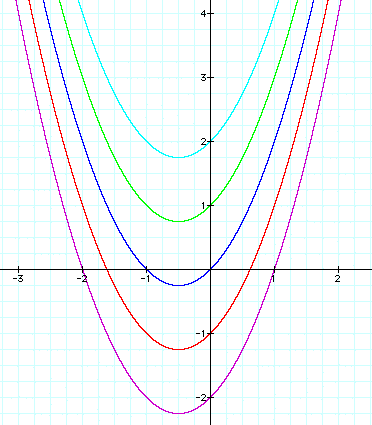
Here, the size and shape of the parabola remains
the same. However, the location of the parabola changes as b varies.
In every case, the parabola passes through
the point (0,1). In fact, the parabola will always pass through
the point (0,c) and remain tangent to the line y = bx + c at this
point.
Let's explore the location of each
vertex of the above parabolas. If we were to trace a path along
the location of each vertex as b changes, we would trace out a
path of another parabola. In this example, the parabola would
be facing down and have its vertex at the point (0,1). This path
is the parabola:  , which is shown
in yellow below.

Notice that the vertex of each graph passes
through this parabola.
If we were to explore with various values
of a and c, we would find a general formula for this parabola:

As b changes, the location of the vertex of
the parabola moves along this path.
Click here to animate the graph of  as
b changes and a and c remain fixed.
Last, let's explore what happens as we vary
the value of c, and fix the values of a and b.
Let a = 1 and b = 1. Examine the following
graphs...
 |
Purple
|
 |
Red
|
 |
Blue
|
 |
Green
|
 |
Aqua
|

Again, the size and shape of the parabola remain the same
as c changes. However, the location of the parabola does change.
The parabola shifts up or down depending on the value of c.
If c is positive, the parabola shifts up c units from the standard
graph,  , or when c equals 0. If c is negative,
the parabola shifts down c units.
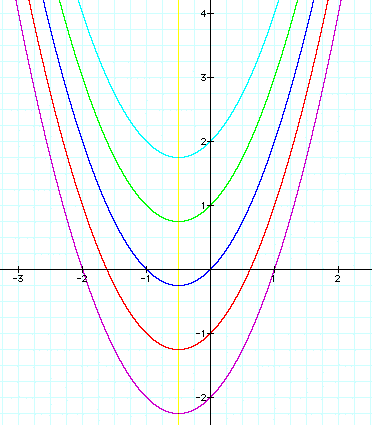
If we trace the vertex of each parabola as c changes, we trace
out a path of a vertical line. In this example, the line is:
 , which is shown in yellow below.

The vertex of each parabola passes through this yellow line.
In conclusion, varying the values of a, b, or c in
the graph of 
can cause changes in the shape and/or location of
the parabola.
Extensions of this problem may
be to explore the graph of:

as the values of a, b, c, and
d vary.


 , which is shown in yellow below.