Using the Spreadsheet in Mathematics
Explorations
by
Rita Meyers
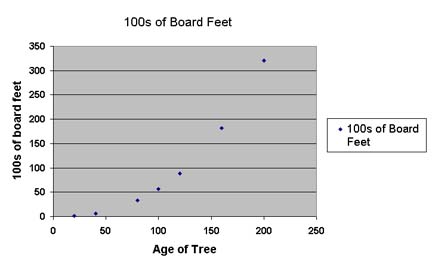
This Exploration deals with trying to predict how many board feet
you can get from from a tree in a forest given the age of the
tree. The following data was acquired from the lumber industry.
|
Age of Tree |
100s of Board Ft |
|
20 |
1 |
|
40 |
6 |
|
60 |
|
|
80 |
33 |
|
100 |
56 |
|
120 |
88 |
|
140 |
|
|
160 |
182 |
|
180 |
|
|
200 |
320 |
To get a real understanding of the data, let's graph
the information with a scatterplot graph
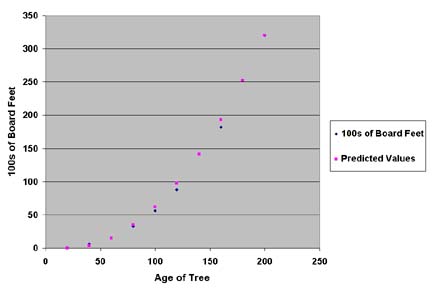
Using our excel spreadsheet we can predict values...
A possible equation we can try would be
So now that we have an equation let's put it in our
spreadsheet and see what predictions we can make...
|
Age of Tree |
100s of Board Feet |
Predicted Values |
|
20 |
1 |
.01 |
|
40 |
6 |
3.58 |
|
60 |
|
15.15 |
|
80 |
33 |
34.72 |
|
100 |
56 |
62.28 |
|
120 |
88 |
97.85 |
|
140 |
|
141.42 |
|
160 |
182 |
192.99 |
|
180 |
|
252.56 |
|
200 |
320 |
320.12 |
We will now compare this table with the given table
by looking at the scatterplot of the predicted values overlaying
the previous graph.
Comparison Graph
With this information let's predict a few more
Age of Tree Predicted Values
|
Age of Tree |
100s of Board Feet |
|
5 |
2.59 |
|
56 |
12.19 |
|
97 |
57.64 |
|
158 |
187.47 |
|
295 |
750.32 |
|
375 |
1252.59 |
|
450 |
1839.72 |
Click here to see the actual Spreadsheet
Data
Return to
Student Page