Assignment 10
Parametric Curves
by
Sharon Sewell
Fall 2001
This is my last write up for EMAT 6680 and I have come to
some conclusions. One I enjoyed working on the computers, but found
it equally as frustrating. They are definitely a great tool for the
classroom. So many students are visual learners and the programs
we explored in this class were good examples of how to enable the visual
learner better "see" the material being taught. I had never really
worked with parametric curves before so the graphing calculator was very
helpful.
I changed every kind of variable possible in the equations
x = cos t and y = sin t. Then I graphed each change to see how each
picture changed. This was my version of a beginners exploration of
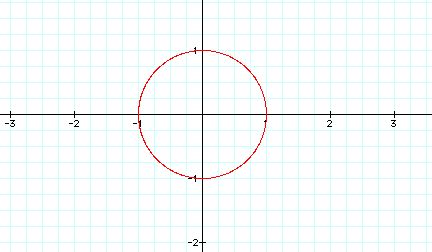
parametric curves. Let's start with the most basic graph, where x
= cos t and y = sin t. The graph is a circle as long as the variable
t goes from 0 to 2ą. Click here to change the range of t. When the variable
range is reduced parts of the circle disappear but the diameter does not
change.
If the variable is multiplied to the t value the shape changes.
When the value on cos t is different than the value on sin t the shape
becomes a bow tie.
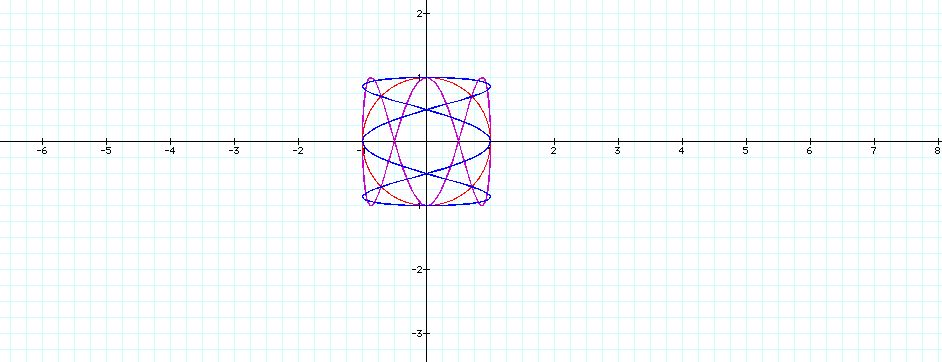
The shape stays a circle when the value multiplied to the
t in both equations is the same.
Now if the value is multiplied to the front of the equation
while the values multiplied to t stays at one, the circle is amplified.
If the value is multiplied to the equations when the t values are different
then bow tie shape is amplified.
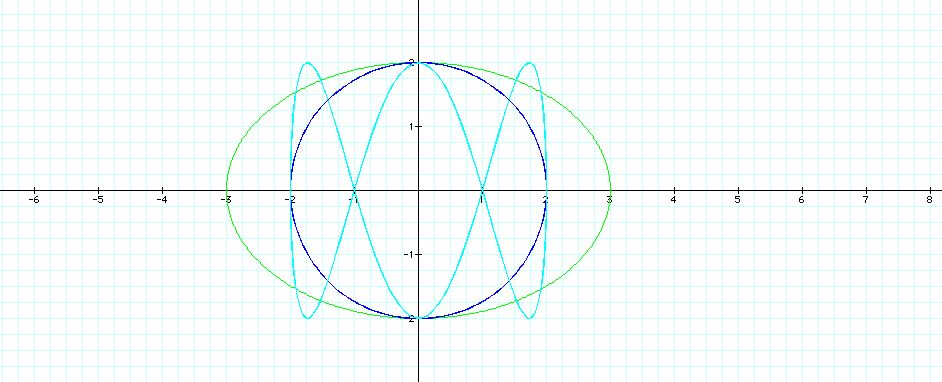
If the value is multiplied to the front of the equation are
different for cos t and sin t the shape becomes an oval.
There are probably very involve proofs and explanations
of why all of these things happen, but this would be a good starting point
for a lesson plan on parametric curves. It would catch the student's
attention and get them asking questions on why the changes take place.
As the lesson progresses these pictures could be referred back to for visual
explanations.
Return to Sharon's Home Page