Assignment 11
Polar Equations
by
Sharon Sewell
Fall 2001
This is a beginners exploration of Polar Equations.
I have never really worked with them before so I will be teaching myself
about their properties in a very remedial visual way.
A polar equation is r = a + b cos(kż). I will change
each of the variables in turn to see how they affect the graph of the equation.
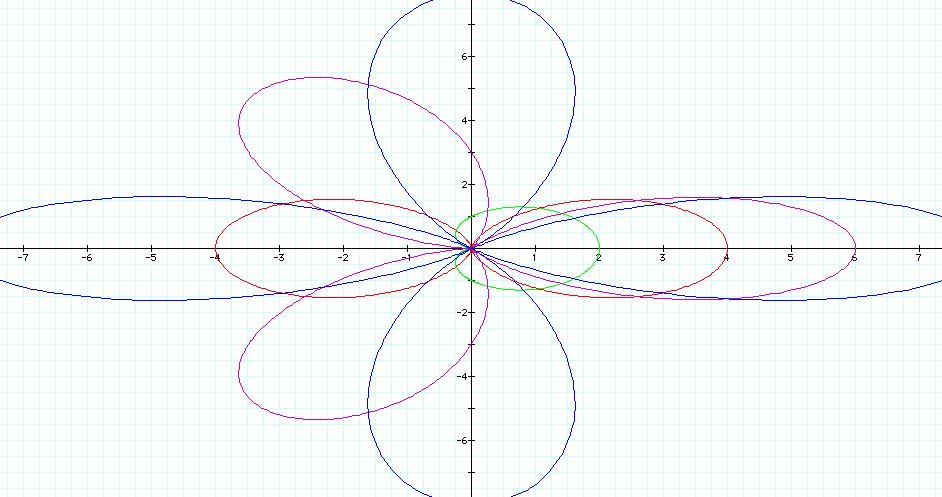
First let's change the k variable. At one the graph looks like a
sideways heart. The indent is looks to be at (0,0). When there
is a number multiplied to the k value the picture begins to change.
Loops begin to form. A 2k the picture is a figure 8. A petal seems
to be added with each additional value multipled to k. It ends up
looking much like a daisy.
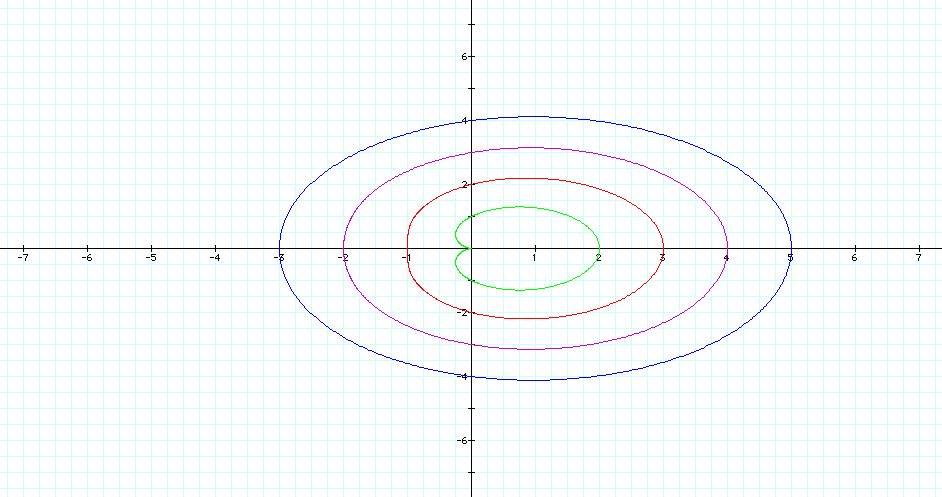
Next the a value will be changed and the other variables
will stay constant at one. The picture becomes more of an oval as
the value of a is increased. The size of the oval increases as well
as the indent on the side disappears. A good further exploration
may be to see if it ever changes into a circle or changes to a completely
different shape.
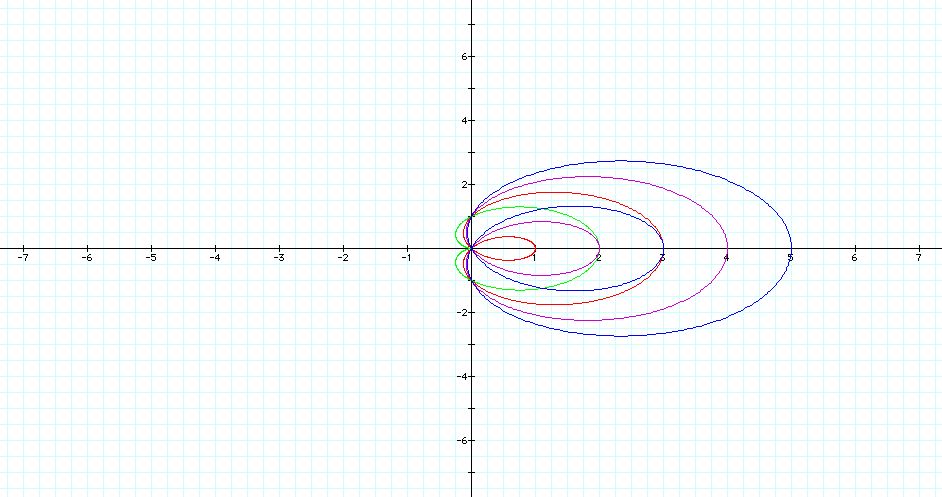
When the b value is varied and the a and k values are
kept constant at one the loop starts to form another loop inside it.
The larger the b value the larger the loops inside it.
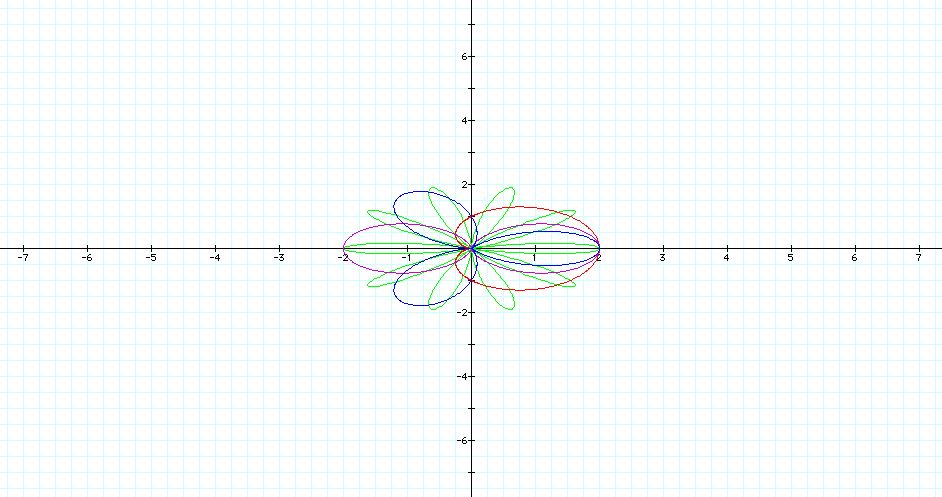
Now just for fun I will vary all of the variables at once.
It becomes quite a picture.
This is quite and involved graph and to properly explore
it, it should be broken down into four different graphs. There is
much more to be learned on the subject of Polar Equations.
Return to Sharon's Homepage