Assignment 2
Exploring Parabolas
by
Sharon Sewell
Fall 2001
I will do a very basic exploration of a parabola and how
changing one value in the equation while keeping the others constant will
change the graph. The values that will be used are a, b,
and c. Which values will shift the graph to the left or right?
What makes the graph move up and down the y-axis? What makes the
parabola flatten out or become skinnier?
Our equation is y= ax2 + bx + c.
I will change the c value first while keeping a and b
constant at one.
y= x2 + x + 0.5
y= x2 + x + 1
y= x2 + x +1.5
y = x2 + x + 2
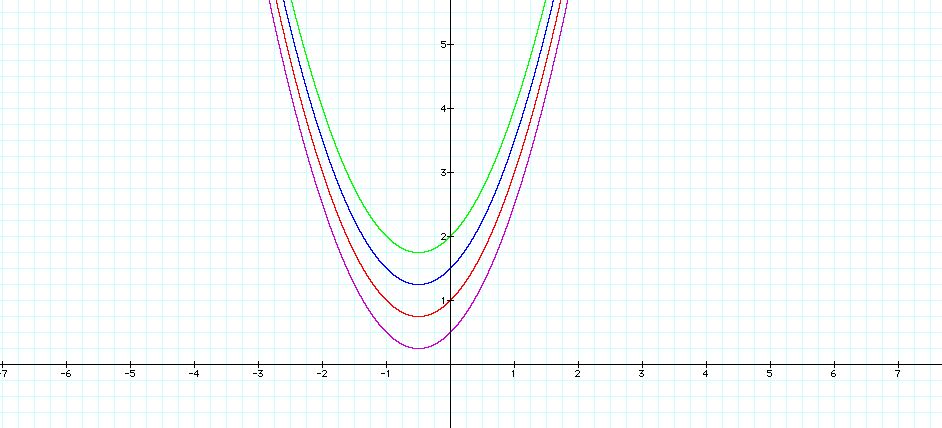
The changing of the c value shifts the parabola
up and down the y-axis while not changing the shape nor moving is from
left to right. The y-intercept can be calculated by putting an x
value of 0 in and solving the equation for y. So one can see both
on the graph and algebraically that the c value is the y intercept.
Next the b value will be varied
while the a and c values will be kept constant at one.
y= x2 + 0.5x + 1
y= x2 + x + 1
y= x2 + 1.5x +1
y = x2 + 2x + 1
We should speculate ahead of time how changing
the b value will affect the graph. Will it again shift the parabola
up and down the y-axis? Will it change the shape at all? Or
will it move the graph from left to right or right to left? Now we
will see.
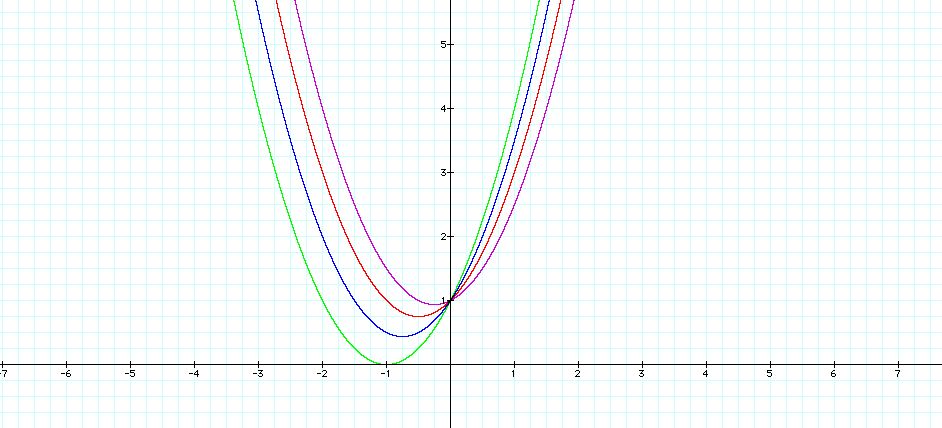
At first glance it looks as if the graphs shifted up and
to the right. But on closer inspection that is not true. They
simply moved to the right. The y-intercept never changed. It's
almost as if there is a loop on the point (0,1) and the graph has to slide
through that loop to move.
Now we have seen the graph move up and down the y-axis
and shift from left to right. Do you think that changing the a value
will repeat either of those or do something different?
y= 0.5x2 + x + 1
y= x2 + x + 1
y= 1.5x2 + x +1
y = 2x2 + x + 1
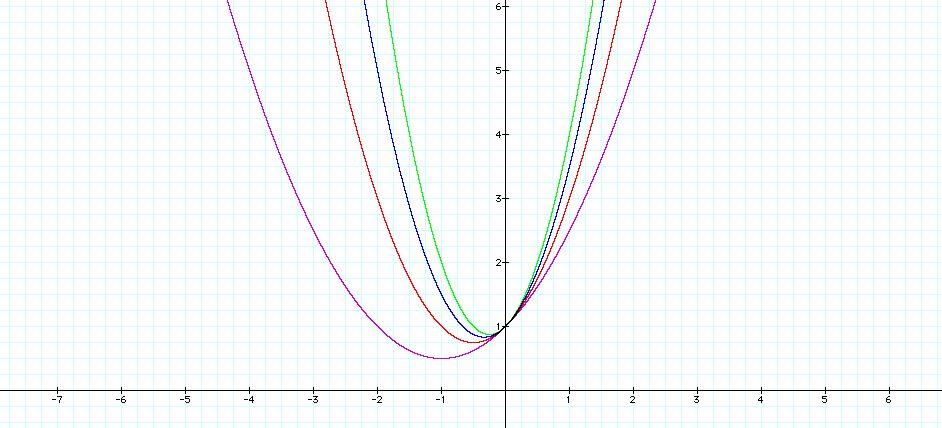
The slope has stayed at (0,1). It also
looks as if the location of the minimum of each graph is the same as when
the value b was at one in the first example. But the shape of the
graphs has changed. The smaller the a value the "fatter" the parabola
is.
I really enjoy working with this
software. It will be invaluable for the visual student. Color
coding the lines enables the learner to better see how the graph has changed
as the values change.
Return to Sharon's Homepage