
In this write-up, I examine explorations with the distance formula. The first observation is the equidistant set from a fixed point. The other observations look at the sum, difference, product and quotient of the distances from a point (x, y) to two fixed points when they are a constant value. For each exploration, the resulting graphs and equations are examined.
Given the points (3, 4) and (-5, -2), the distance from another point (x, y) to each of the given points can be expressed by the following equations:
Distance from (x, y) to (3, 4):
Distance from (x, y) to (-5, -2):
When the value of d is set equal to a constant, the resulting graphs are circles with centers at (3, 4) and (-5, -2) and radii of length d. For d = 2 the following graphs result:
Graph of circle with center at (3, 4) and radius of 2:

Graph of circle with center at (-5, -2) and radius of 2:

For any given point, the locus of points equidistant from the original point will be a circle with radius of the constant distance.
Given points (3, 4) and (-5, -2), the sum of the distances from each point to another point (x, y) can be expressed by the following equation:
When the value of d is set equal to a constant, the resulting graph is an ellipse with focal points of (3, 4) and (-5, -2) and sum of focal radii equal to d. The following graph shows the ellipse formed when d = 12.
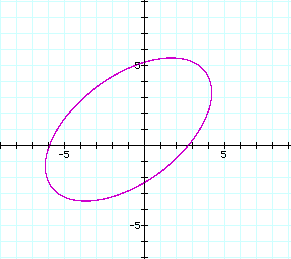
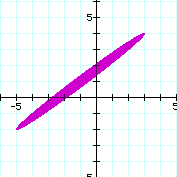
The distance between (3, 4) and (-5, -2) can be calculated using the distance formula, and is found to be equal to 10. When the sum of the distances from (3, 4) and (-5, -2) to (x, y) is set equal to a constant less than 10, then there is no graph generated from the equation above. This is because the shortest distance between two points is a straight line. Therefore the sum of the distances from two points to another arbitrary point must be greater than the distance between the initial two points. This is the same as the triangle inequality, which states that the length of the side of a triangle must be less than or equal to the sum of the remaining two sides. The smallest value of d for which a graph of the equation exists is 10, and at this value the graph is a segment between (3, 4) and (-5, -2) as shown below:
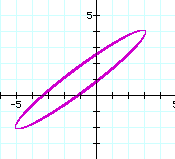
For d = 10.1, the graph is open forming an ellipse as shown below:
As the value of d increases, the shape of the ellipse widens and then lengthens as shown by the graphs for d = 15 (blue ellipse) and d = 20 (red ellipse) shown below:
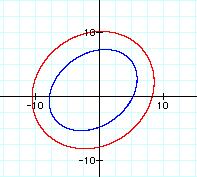
For all values of d>10, the graph of d equal to a constant and the sum of the distances from two fixed points to an arbitrary point (x, y) becomes an ellipse with foci at the two fixed points.
Given points (3, 4) and (-5, -2), the difference of the distance from (3, 4) to a point (x, y) and the distance from (-5, -2) to the same point (x, y) can be expressed by either of the following equations:
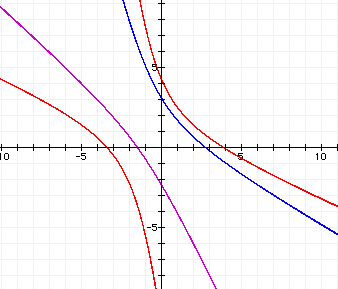
When either of these equations is graphed for d > 0, the graph is half of a hyperbola. When both equations are graphed set equal to the same value of d, then the graph is the whole hyperbola. The case where d = 0 will be discussed later. The graph below shows the first equation for d = 2 (purple graph), the second equation for d = 4 (blue graph), and both equations for d = 5 (red graph):
The graph below shows the equations for d = 0 (blue graphs) and the equation for the line through (3, 4) and (-5, -2) (red graph), which is the following:

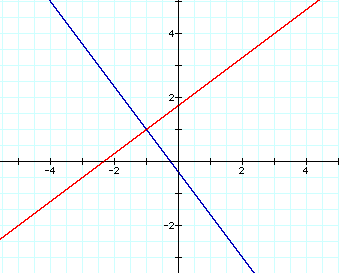
When the equations for the half hyperbolas are set equal to d = 0, they both become the equation of the same line with the following equation:

The line through (3, 4) and (-5, -2) has a slope of ![]() ,
and is therefore perpendicular to the line formed when the difference
of the distances is 0, and the point where the two lines intersect
is (-1, 1). This point is the midpoint of the segment with the
endpoints (3, 4) and (-5, -2). Therefore the line with the equation
,
and is therefore perpendicular to the line formed when the difference
of the distances is 0, and the point where the two lines intersect
is (-1, 1). This point is the midpoint of the segment with the
endpoints (3, 4) and (-5, -2). Therefore the line with the equation

is the perpendicular bisector of this segment. By definition, the perpendicular bisector of a segment is the set of points equally distant from the two endpoints of the segment. This means that the difference of the distances from those two points must equal zero.
The last two observations dealt with common conic sections as functions of the distance formula. Considering the same fixed points, the product of the distance from (3, 4) to a point (x, y) and the distance from (-5, -2) to the same point (x, y) generates the following equation:
The graph below shows the curves for d2 > 25 (purple graph), d2 = 25 (red graph), and d2 = 10 (blue graph). The graph for d2 = 0 is the two points (3, 4) and (-5, -2). This is because these are the only two values for (x, y) that generate a distance of zero from one of the fixed points. There is no graph when d < 0, because distance is not negative.
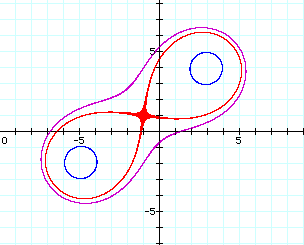
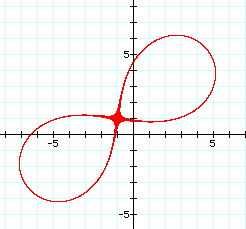
The graphs represent the loci of a point (x, y) such that the product of the distances from (x, y) to two fixed points is a constant value d2. If the distance of the two fixed points is represented by 2*a, then the shape of the graphs can be determined by the relationship between d and a. These graphs are called Cassinian ovals. When the value of d = a = 5 for the focal points given (red graph), the curve generated is a special case of the Cassinian oval called the Bernoulli Lemniscate. This graph resembles a figure eight, and the point of intersection is the midpoint of the segment with endpoints (3, 4) and (-5, -2). At this midpoint, the distance to each endpoint is a = 5 (half the total length of the segment). Therefore the product of the distances (d2) is 25, so d = 5. The graph of the lemniscate is shown below.
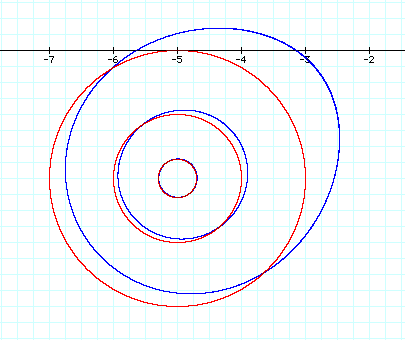
For positive values of d < a, the curve consists of two loops which appear circular. Upon closer inspection it can be seen that they are not exact circles, and as d approaches 25 the shape becomes egg-like. The following figure shows the bottom halves of the graph of the product of distances for d2 = 3, d2 = 10, and d2 = 20 (graphs shown in blue), and the graph of circles with center (-5, -2) and radii r = .3, r = 1, and r = 2 (graphs shown in red). These graphs demonstrate the changing shape as the figure approaches d2 = 25.
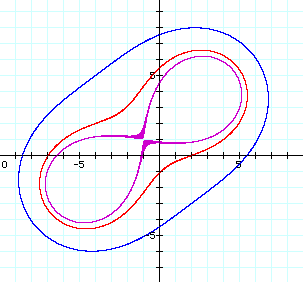
For values of d > a, the curve is a single loop that begins close to a figure eight as shown for d2 = 25.1 (purple graph), expands to peanut shape for d2 = 30 (red graph), and then becomes oval shaped for large values of d2 such as 50 (blue graph).
For extremely large values of d, for example d2 = 625 = a4, the graph appears circular. The graph below shows the equation for the product d2 = 625 (blue graph) and the graph of a circle with center at (-1, 1) and radius of 25 (red graph).

Upon closer inspection of a portion of this graph, it can be determined that the two graphs are not the same. The graph of the product of the distances (blue graph) still has an oval shape in contrast with the circle.

Having observed the graph of the equation for a constant product of distances from two fixed points, the next step is to look at the graph for a constant quotient of distances. Considering the same fixed points, the quotient of the distance from (3, 4) to a point (x, y) and the distance from (-5, -2) to the same point (x, y) generates the following equation:

And the quotient of the distance from (-5, -2) to a point (x, y) and the distance from (3, 4) to the same point (x, y) generates this equation:

The graph of each equation exists for all values of d _ 0. For d = 0, the first equation becomes the graph of the point (3, 4) and the second equation becomes the graph of (-5, -2). Both fixed points are not graphed for a single equation with d = 0 because the fixed point involved in the divisor would yield a zero in the denominator. For the value of d = 1, the graph of both equations is the perpendicular bisector of the segment with endpoints (3, 4) and (-5, -2), as shown by the blue graph below. The red graph is the graph of the equation of the line through (3, 4) and (-5, -2).
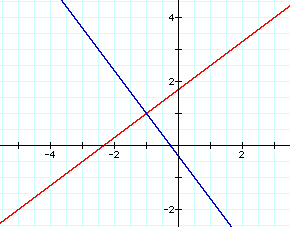
For the quotient of the distances from two fixed points to another point (x, y) to equal 1, then the point (x, y) must be equidistant from both of the fixed points. The locus of points equidistant from two fixed points is defined as the perpendicular bisector.
For values of d 0 and d 1, the graph becomes a circle. The equation for the circle can be determined by squaring both sides of the quotient and then rearranging the equation. To discuss the changes in the graph, we will consider the first equation:

Different values of d result in different circles. For values where 0 < d < 1, the center of the circle is closer to (3, 4). As d approaches zero, the radius of the circle becomes smaller, and as d approaches one the radius of the circle becomes larger. This makes sense because a smaller decimal would result when (x, y) is very close to (3, 4) and farther from (-5, -2). For example, with d = .5, the distance from (x, y) to (-5, -2) will always be twice the distance of (x, y) to (3, 4). When d = .1, the (x, y) will be 10 times farther from (-5, -2) as it is from (3, 4). Because possible values for (x, y) can only be so far from (-5, -2) and maintain a constant value for d, the values for (x, y) must get even closer to (3, 4). When d approaches 1, the distances from (x, y) to each of the fixed points are getting closer to the same value. The circle is growing larger and approaching the line that is the perpendicular bisector of the segment between the fixed points. These observations are shown graphically for d = .1 (red graph), d = .5 (blue graph), and d = .8 (green graph) below:

When d > 1, the values for (x, y) are closer to (-5, -2) than they are to (3, 4) because a smaller distance is dividing into a larger distance to yield a quotient larger than 1. This results in a circle with a center closer to (5, -2). As the value of d becomes larger, the radius of the circle becomes smaller. This is the reverse of what occurred when d < 1. Now the values of (x, y) are getting closer to (-5, -2) as d grows larger, so the radius of the circle becomes smaller. This observation is shown graphically for d = 2 (red graph), d = 5 (blue graph), and d = 10 (green graph) below:

To demonstrate that the graph of the constant quotient of two distances is a circle, the equation for d = 2 is examined. When both sides of the original equation are squared and the result is rearranged, the following equation is obtained:

Graphing this equation along with the original equation with d = 2 results in the same graph. Both graphs are shown below, but this is difficult to see because they are overlapping each other. The original equation is graphed in red and the corresponding equation for the circle is graphed in green:
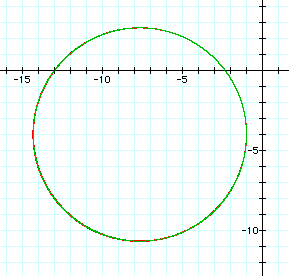
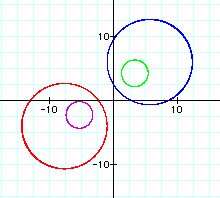
Graphing the other equation with (-5, -2) as the fixed point in the numerator results in similar observations with the approximate location of the centers of the circles reversed. The equation

is graphed below for d = .2 (purple graph), d = .5 (red graph), d = 2 (blue graph), and d = 5 (green graph):
So far the graphs have been explored for the constant sum, difference, product and quotient of the distances from two fixed points. When the sum of the distances from two fixed points is constant, the graph becomes an ellipse. For the constant difference of distances, the graph is half of a hyperbola. When the product of the two distances remains constant the graph is called a Cassinian Oval, with a special case known as the Bernoulli Lemniscate. Finally a constant quotient of distances results in a circle.
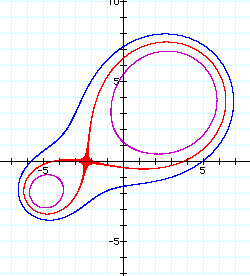
Other combinations of the distances from (x, y) to (3, 4) and (-5, -2) yield variations of these graphs. For example, if the sum of the squares of the distances remains constant, the graph becomes a circle. An interesting combination to conclude the exploration is the graph of the following equation:

This represents a constant product of the square of the distance from (3, 4) and the distance from (-5, -2). The result is a variation of the Cassinian oval. The graph exists for all values of d > 0. For d = 0, the graph is the two points (3, 4) and (-5, -2). For 0 < d < 148.148, the graph consists of two "ovals". At (x, y) = (-7/3, 0), which is the point where the line through (3, 4) and (-5, -2) crosses the x-axis, the graph becomes a lemniscate. For values of d > ~148.148 (3960/27) , the graph is one "oval". For all three graphs, the portion of the curve closest to (-5, -2) is much smaller than the portion of the curve closest to (3, 4) The graph of the equation above for d = 100 (purple graph), d = ~148.148 (red graph), and d = 200 (blue graph) is shown below:
