
By nami Youn
By nami Youn
Write-up #1
Exploring graphs of y= asin(bx+c)
for differen values a, b, and c.
Introduction
In this write-up, I examine the graphs of y=asin(bx+c) for different values a, b, and c.
First, I fix the values of "b" and "c" at 1 and examine what happens to the graph as I vary the values of "a". Then, I fix the values of "a" and "c" at 1 and examine what happens to the graph as I vary the values of "b". Finally, I fix the values of "a" and "b" at 1 and examine what happens to the graph as I vary the values of "c.
I note the whole changes in the graphs of y=asin(bx+c) as I vary the values a, b, and c.
1. Varying the values of "a"
1) Let b=1 and c=1. Then let's compare the graphs of y=asin(x+1) when
a=0.5, 1, 2, and 3.
y=0.5sin(x+1)(purple curve) y= sin(x+1)(blue curve)
y= 2sin(x+1) (yellow curve)
y=3sin(x+1) (green curve)
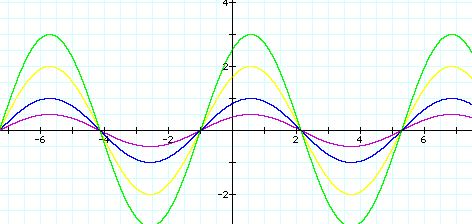
Let's notice the amplitude of each graph.
On the graph, a ranges from 0.5 to 3. As a increses,
the graph has more maximum and minimum points.
|
|
minimum value of the graph | |
| y = 0.5sin(x+1) |
|
|
| y= sin(x+1) |
|
|
| y = 2sin(x+1) |
|
|
| y = 3sin(x+1) |
|
|
Therefore, changing a affects the amplitude, maximum and minimum points of the graph y= asin(bx+c)
Also, the smaller the values of a , more "spread out"
the graph appears. That is, as a increases, the graph appears more compressed.
2) Now, let's look at the graphs of y=asin(x+1) when a=2 and -2, especially, a is negative.
y= 2sin(x+1) (yellow curve)
y= -2sin(x+1) (green curve)

Again, the amplitude has been changed to a. But, the range of the graph of two graphs is the same, from -2 to 2.
If a is negative, -2, the graph is flipped. Therefore,
the value of affects the concavity of the graph of y= asin(bx+c)
y=sin(0.5x+1)(purple curve)
y= sin(x+1)(blue curve)
y= sin(2x+1) (yellow curve)
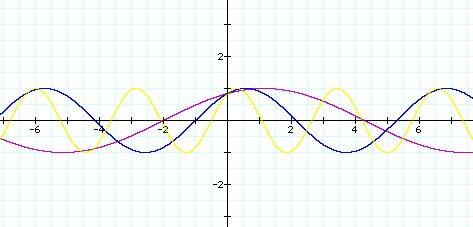
Let's notice the period of each graph.
Compare the periods of two graphs in case b=1(blue) and
b=2(yellow).
We can notice that within one period of the graph when
b=1, there are two peroids when b=2.
Again, compare the periods of two graphs in case b=0.5(purple)
and b=2(yellow).
We can notice that within one period of the graph when
b=0.5, there are four peroids when b=2.
Therefore, as b decreses, the periods of the
y= asin(bx+c) increases, so the graph appears to smooth.
But, the maximum and minimum values are not changed.
y= sin(2x+1) (yellow curve)
y= sin(-2x+1) (green curve)
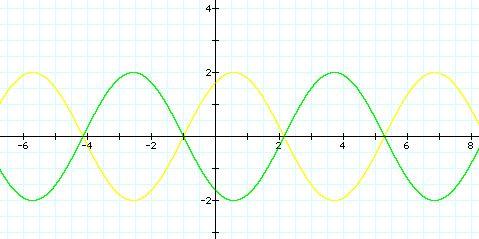
First, let's notice the period of each graph.
The period of two graphs is exactly the same. That means
that the graph still has two periods within b=1. But, the graph when b=-2
has been shifted to the right.
y =sin(x-1)(purple curve) y = sinx(blue curve)
y = sin(x+1) (yellow curve)
y =sin(x+2) (green curve)
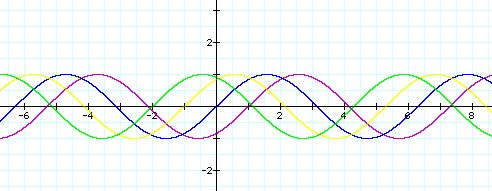
When c is positive, we can see that the graph shfit to
the left and across the y-axis when y = -c.
Again, when c is negative, the graph shifts to the right
and across the y-axis when y = c.
Therefore, varing the value of c shifts the graph to the left or right .
Extension
Now, try to predict how the following graphs will look like.
y = -sinx
y = 2 sin( x -1)
y = -4 sin( 3x+1)
y = 0.5sin(-x - 2)