
By Nami Youn
By Nami Youn
Write-up #10
Introduction
A parametric curve in the plane is a pair of functions
Where the two continuous function define ordered pairs (x,y). The two equations are usually called the parametric equations of a curve.The curve is dependent on the range of t.
In this write-up, I will investigate the parametric equations and variation of these equations.
x = acos(t)
y = bsint(t) ![]() for
various a and b
for
various a and b
1. For a equals
to b,
x = acos(t)
y = bsint(t)
First, let's consider the case a, b > 0.
a = b = 1 (purple), a = b = 2(blue), a = b = 4(green)
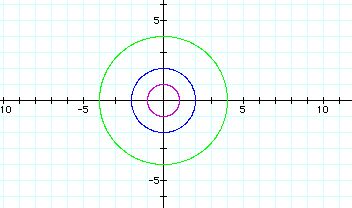
We can notice that the all graphs are the circles centered
at the origin(0, 0). Specially, for a = b = 1, the graph is the unit circle.
The radius are 1, 2, 4 respectively, the same value as a =b.
So, we can see that the value of a=b decides the
radius of the circle, the graph of x = cost (t), y = sin(t). Also, as the
value of a=b increases, the radius of the circle is greater.
a = b = -1 (purple), a = b = -2(blue), a = b = -4(green)
We can get the same graphs as the case a, b>0. Notice
that the all graphs are also the circles centered at the origin(0, 0).
Specially, for a = b = -1, the graph is the unit circle. The radius are
1, 2, 4 respectively, the same as the absolute value of a =b.
So, we can see that the absolute value of a=b decides
the radius of the circle, the graph of x = cost (t), y = sin(t). Also,
as the absoulte value of a=b increases, the radius of the circle is greater.
We have another result through investigation of the graphs. If the absoulte values of a and b of two equations are the same, the two graphs are exactly equal. For example, the graphs of both x = cost (t), y = sin(t) and x = -cost (t), y = -sin(t) are the same.
2. For
a does not equal to b,
x = acos(t)
y = bsint(t)
b = -2(purple), b = 3(blue), b = 5(green)
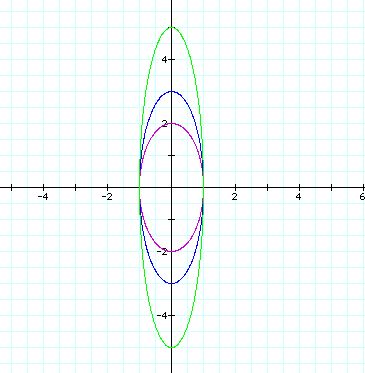
It is obvious that the graphs are ellipes. The center
of the all ellipes is the origin(0, 0).
Also, we can notice that the graph is enlongated along
the y-axis as the absoulte value of b increases.
a = -2(purple), a = 3(blue), a = 5(green)
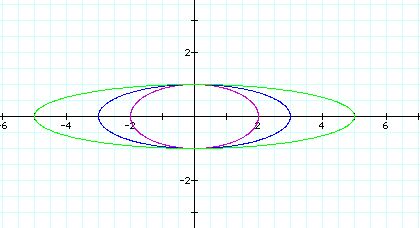
We have the different shape of ellipes. But, the center
of the all ellipes is still the origin(0, 0).
We can notice that the graph is enlongated along the
x-axis as the absoulte value of a increases.