Today I am going to look at problem number 6 on problem set one. I am going to explore the equation x^n + y^n = 1 where n are positive integers and compare the graphs of the equation when n is even to the graphs of the equation when n is odd.
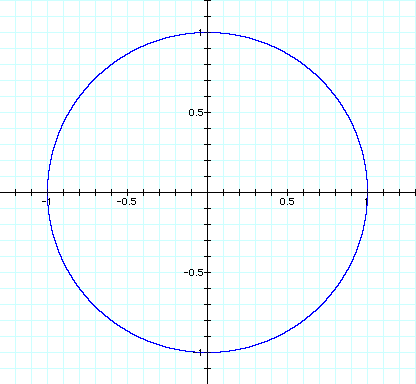
First I graph x^2 + y^2 = 1.
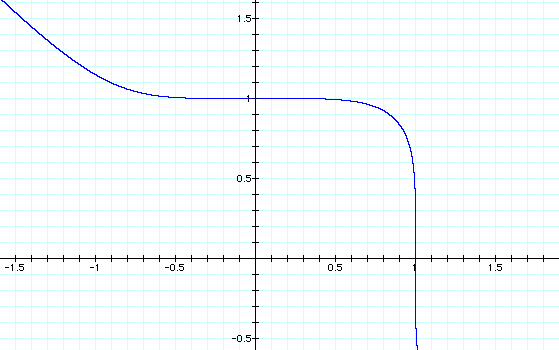
Of course it is the unit circle, but what is important to notice is that the slope of the tangent line changes signs everytime it crosses one of the axes (the x and y axes). Therefore the slope of the tangent line is negative in the first quadrant, positive in the second quadrant, negative in the third quadrant, and positive in the fourth quadrant. Also the slope of the tangent line is 0 on the top and the bottom and undefined on the sides. We can see this by graphing the derivative.
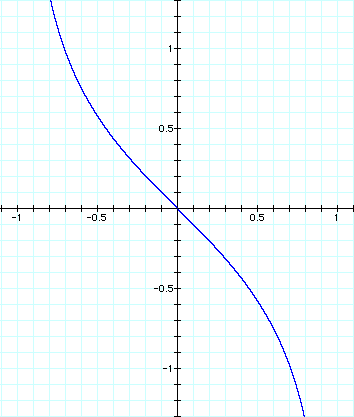
From this graph we see that the derivative (the tangent line of the original graph) is sometimes positive and sometimes negative. It is positive when both the x and the y in the original equation are positive or negative and negative when x and y have opposite signs.
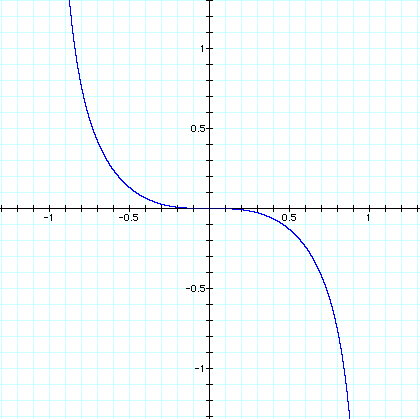
Now let's graph x^3+y^3=1
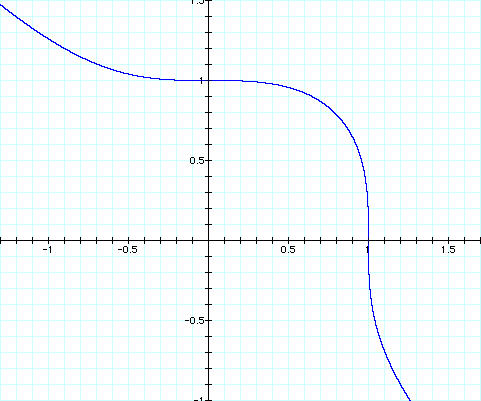
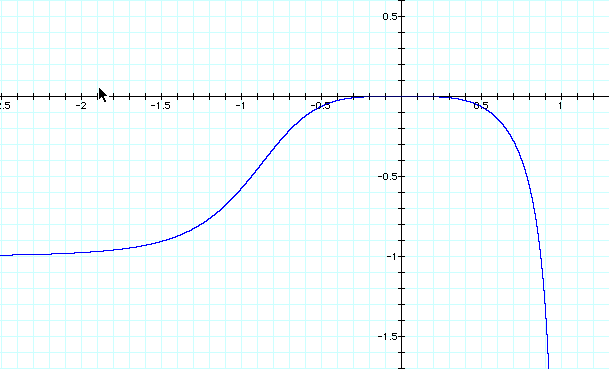
This time the tangent line starts in the second quadrant by having a negative slope that is decreasing but the line is becoming less and less steep (in a sence, the slope is less negative) as x increase until the slope becomes zero at the origin. Then in the first quadrant the slope starts to become negative again, but this time the tangent line becomes steeper until the tangent line is vertical at the axis. Then in the fourth quadrant the tangent line becomes less and less steep again. Looking at the graph we can see that the slope of the tangent line is negative in all three of the quadrants containing the curve. To illustrate, here is the graph of the derivative of this equation.
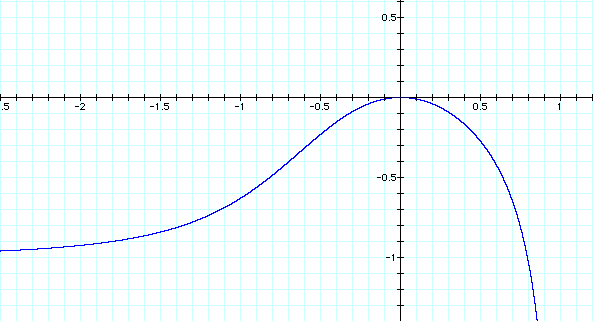
See, as I thought, the derivative is always negative or 0.
Now let's see what x^4+y^4=1 looks like.
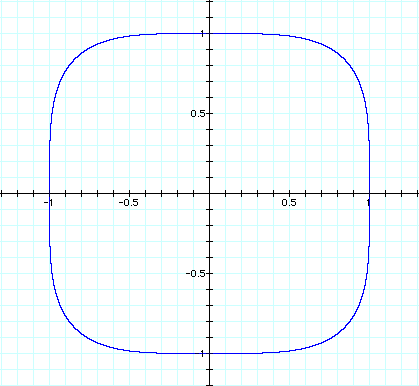
Wow, this looks very similar to our first graph. The only difference is that the curves are more square. Lets see what this does to the slope of the tangent line.
As I expected, this graph looks very similar to the graph of the derivative of the x^2+y^2=1. Only now the interval from -.2 to .2 the graph is close to 0. This in turn forces the slope of the other line to change very slowly and to "flatten out" and become more like a square.
Now I bet that the graph of x^5+y^5=1 will look like the graph of x^3+y^3=1 only it will have an section whose slope changes very slowly like before and the center curve will be more squared.
Right again. Now since the slope of this curve changes very slowly, then the graph of the slope of the tangent line will be close zero for a larger interval.
See the graph is always negative or 0. And it is close to zero for a larger interval than before.
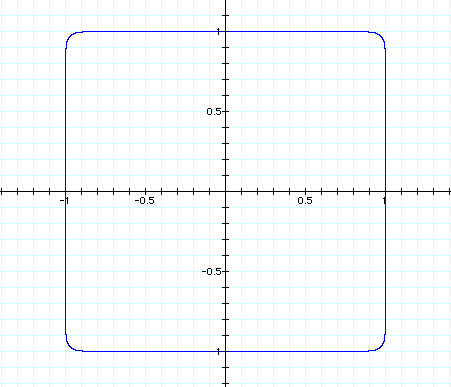
Now I predict that the graph for x^24+y^24=1 will look similar to x^2+y^2=1 and x^4+y^4=1 only it will look even more like a square. I also predict that the graph of x^25+y^25=1 will look similar to x^3+y^3=1 and x^5+y^5=1 only the curve will also be more like a square. Let's see the graphs.
x^24+y^24=1
x^25+y^25
So, the graph of x^n+y^n=1 when n is an even positive integer will be a graph that passes through all four quadrants and the slope of the tangent line will change signs from one quadrant to the next. The larger n is, then the flatter the sides, top, and bottom will be and the more square the corners will be. The graph of x^n+y^n=1 when n is an odd positive integer will be a graph that passes through the first second and fourth quadrant and the slope of the tangent line will always be negative, 0, or undefined. The larger n is, then the more square the center curve will be and the more the outer curves will seperate away from the graph.
Now that we have experimented with n being positive integers lets see what happens if they are negative integers. Will the same hold for the odd and even numbers? Let's see.
x^(-2)+y^(-2)=1
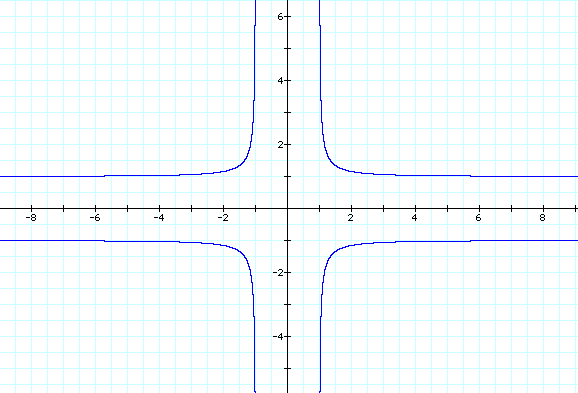
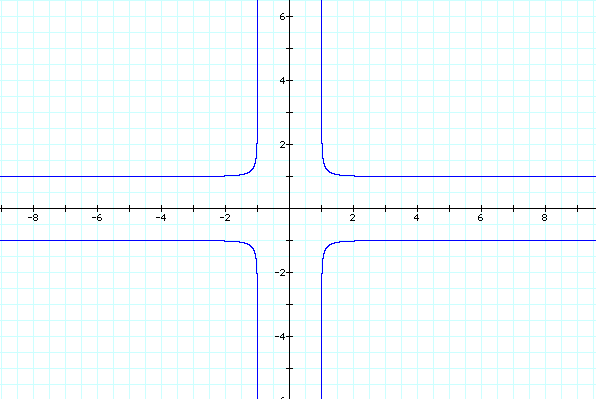
x^(-4)+y^(-4)=1
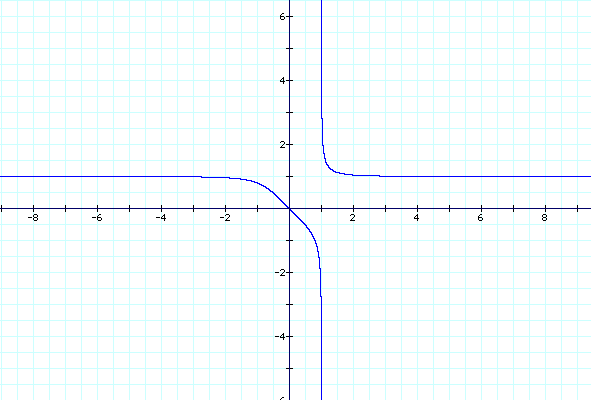
y^(-3)+y^(-3)=1
y^(-5)+y^(-5)=1
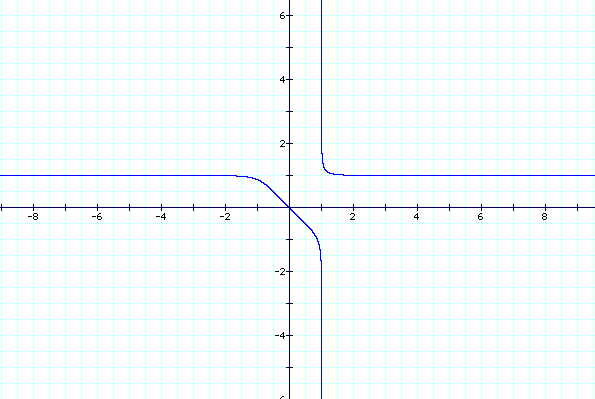
These graphs are different than the ones where n is positive, but we can see that there is still a connection between even integers and between odd integers. Again the graphs of the even integers looked similar but as n got more negative the curves became more square. Also the graphs of the odd integers looked similar but as n got more negative the curves became more square. So in conclusion, in this investigation we have discovered a connection between even integers and a connection between odd integers in the equation x^n+y^n=1. The connection is that the variable n effects the shape of the graph, when n gets larger the shape becomes more square.