I'm a lumberjack and it's OK,cuz I
got my Excel Spreadsheet.
Assignment 12: Modeling fxn's in Microsoft Excel Spreadsheets
- MS excel is a powerful spreadsheet program with the ability
to be used in a variety of careers. Just to name a few, Teachers
can use this program to manage grades, attendance, and trends
in his/her classroom. Engineers can use this program to analyze
experimental data, find trends, validate theories, and predict
outcomes of experiments. In this obeservation, Excel will be
used to analyze data from the lumber industry, given the number
of board feet per tree in a forest with a known age, a function
can be interpolated and used to predict the number of board feet
of lumber per tree for later ages.
-
- To start, the following tree data is considered ->
| Age of Tree |
100s of Board Feet |
|
|
| 20 |
1 |
| 40 |
6 |
| 60 |
|
| 80 |
33 |
| 100 |
56 |
| 120 |
88 |
| 140 |
|
| 160 |
182 |
| 180 |
|
| 200 |
320 |
-
- There are two sets of data: Age of the Tree, and the number
of board feet per tree. From these two sets of data we would
like to create a relation of the two in order to find a potential
significant trend in the data. To start, we can rearrange this
data as a set of points in the Cartesian Plane. The 100s of Board
feet will be set dependent to the age of the tree. The points
will look like the following graph:
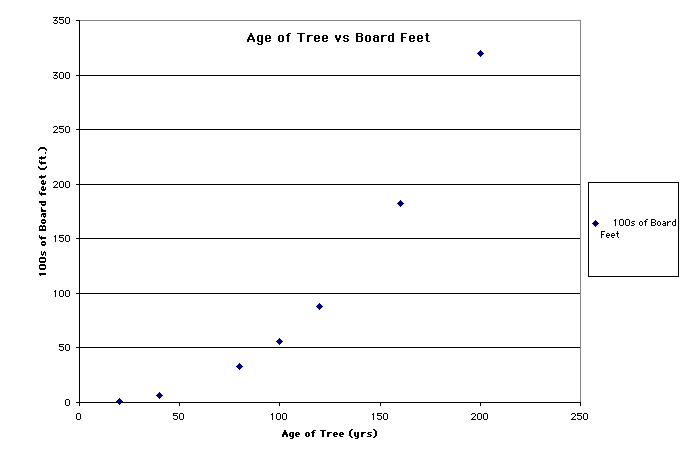
- Click on the chart for a larger view.
-
- Ideally the sets of data would have a direct relation where
the equation of the relation would be a linear equation. To determine
what type of relationship there is between these sets of points,
a trendline must be added to the data set. As such:
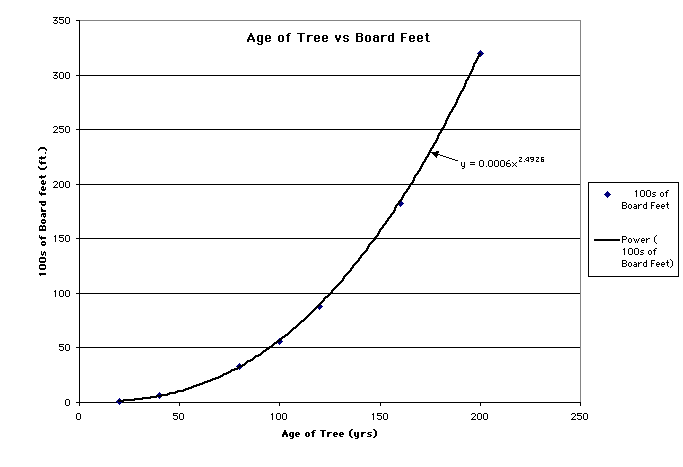
- Again, click on the chart for a larger view.
-
- When finding the trendline for the given data, if you have
no prior mathematical savy, a trial and error approach can be
made to find the best-fit line for the given data. Otherwise,
upon visual inspection of the given data, this data series would
be best represented by an exponential function. In this case
Excel computes the following equation:
-
- y = 0.0006* x^2.4926
-
- This equation can then be used to predict the missing data
points and the number of board feet per tree for older aged trees.
-
| Age of Tree |
Calc # boards |
Age of Tree |
Calc # boards |
|
|
|
|
| 20 |
1 |
220 |
414 |
| 40 |
6 |
240 |
514 |
| 60 |
16 |
260 |
628 |
| 80 |
33 |
280 |
755 |
| 100 |
58 |
300 |
897 |
| 120 |
91 |
320 |
1053 |
| 140 |
134 |
340 |
1225 |
| 160 |
187 |
360 |
1413 |
| 180 |
251 |
380 |
1616 |
| 200 |
326 |
400 |
1837 |
-
- *The Rows highlighted Yellow indicate the number of boards
that were not included in the given data, but calculated using
the equation found from the trendline.
- *The Rows highlighted Light blue
indicate the number of boards that were calculated for the later
tree ages. For a comparison of calculated values and given values
click here->
- Return to Assignment Matrix:
- Questions? E-mail: gt0353d@arches.uga.edu