

The sin function is used in describing oscillating or periodic motion, such as, a vibrating guitar string or tuning fork, a pendulum swinging back and forth, even objects bobbing on the end of a string. Another name for this is harmonic motion. This kind of motion is cyclic; e.g. heartbeats, seasons, and even planetary orbits. There are four terms that describe this motion, they are: amplitude (the maximum value of the function), frequency (the number of cycles per unit interval), period (the reciprocal of the frequency) and phase (the shifting of the graph to the left or right). When 'a' in the expression is varied with b and c fixed, the amplitude is changing. With a and c fixed and b varies, the frequency changes. When a and b are fixed, the phase varies when 'c' changes.
The function y = a sin(bx+c) will be examined for different values of a,b,and c. The basic sin curve looks like this:


When a =1, the graph is the purple - the one with the least variation (up and down) from the X axis. When a = 2, the red graph is produced. The blue graph is produced when a = 5. Finally, when a = 10, the green graph is made, this having the greatest variation.
Click Amplitude Variations to see a movie of "a sin(x)" with variations in the 'a' variable. (Note: to replay the movie, click on the bottom- left arrow; to delete the movie, click in the upper left corner).
The up-and-down movement of the sin curve is due to changes in the amplitude, a. The amplitude is the distance the function moves above and below the center line (here it is the x axis). The function moves a distance of 'a' above and below the center line.
Variations in the 'x' of sin x with a = 1 and c = 0 are very interesting. To view a movie with variations in frequency, (b), click Frequency Variations. These variations apply when the exponent for x is 1 only.
For other types of variations I have the following examples: x^2, x^4 and x^10.


Note as the 'even' exponent gets larger, the graph bounded by -1 and 1 on the y axis, fills in closer and closer to the origin. Now briefly consider sin of : x^3, x^5 and x^11 respectively:


Note that the graph behaves in a similar way with even exponents except for the figure in the center,that is, about the origin. For even exponents the center has a 'cup' shape: from left to right, the slope decreases, reaches zero and then increases in [-1,1]. The shape for odd exponents is similar to one- half of the letter x; from left to right, the slope increases, reaches zero, then increases in the interval [-1,1].
Now consider sin x with x = 1/x, 1/x^10 ,1/x^100 and 1/x^5000:


It seems that the sin curve compresses or fills in when moving towards the origin and then widens as the exponent of 1/x increases. Apparently,as the exponent approaches a large value, the graph looks like a solid square bounded on x/y = [-1,1].
Here are a few examples of sin x with positive and negative fractional exponents:


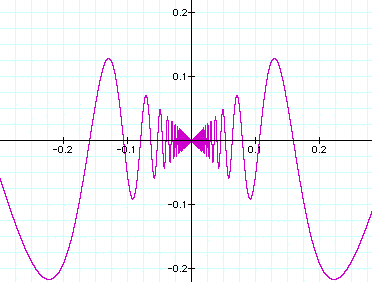
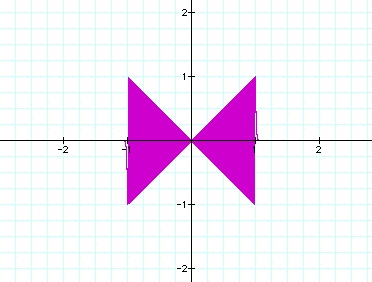
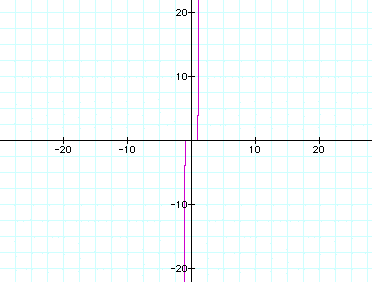
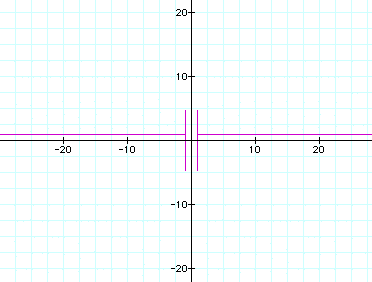
Here are a couple of interesting graphs of the form y = x sin 1/x:


When a and b = 1 and varying c from -2 < c < +2 we have:
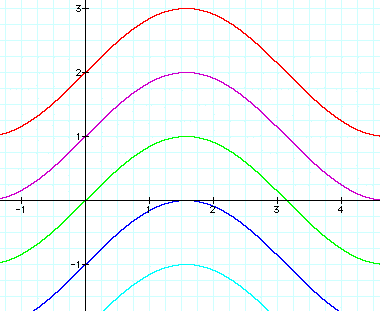
Click HERE to see a movie representing 1sin x + n, where n is [-5,5]. Note that when n the only variable expression, the curve moves or shifts to the left or right. This is the aspect of phase for trigonmetric functions. Finally, click here to see the phase shift, amplitude and frequency variations for the sin curve. This sin curve applies to an x with an exponent of 1.