Assignment # 11
Fall 2002 Semester
Graphing Calculator Revisited - Polar Equations
Section 11.1: Investigation of the equation -
r = a + b cos(kq)
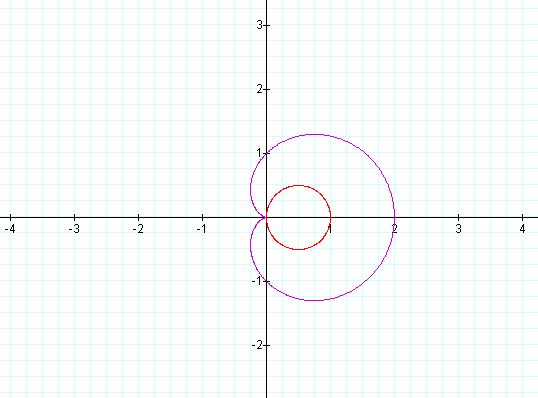
The initial graph shown below is for the case where a=b=k=1
and
q is in the range from 0 to 2p.
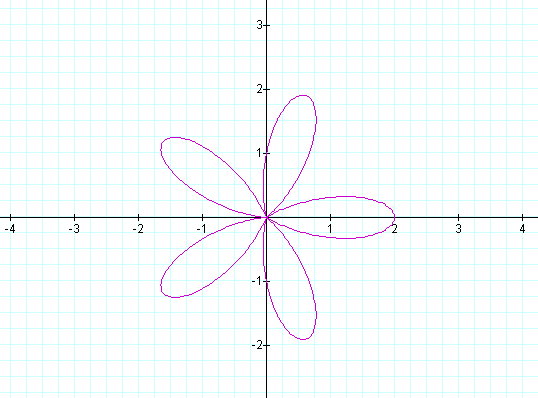
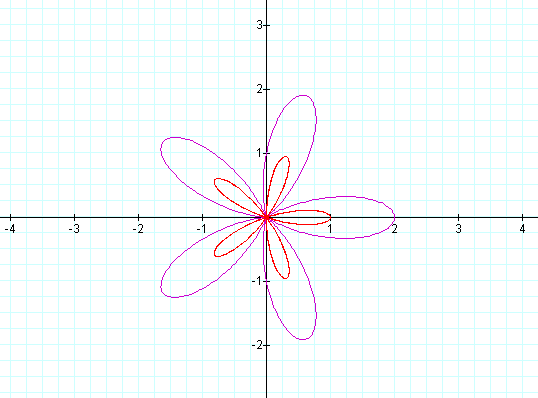
As we change the value of k up from 1, the graph begins to resemble the leafs of a flower, with the number of leaves being the same as the value of k.
e.g. for k = 5, the graph is as follows:
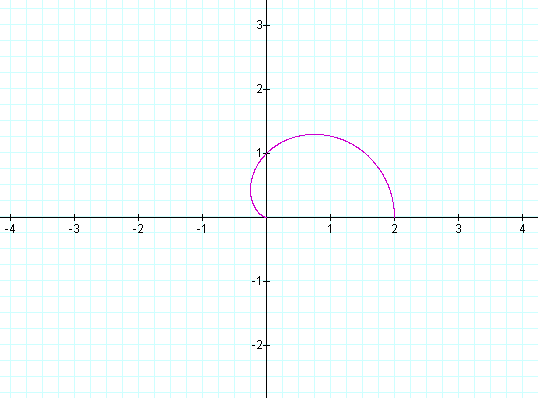
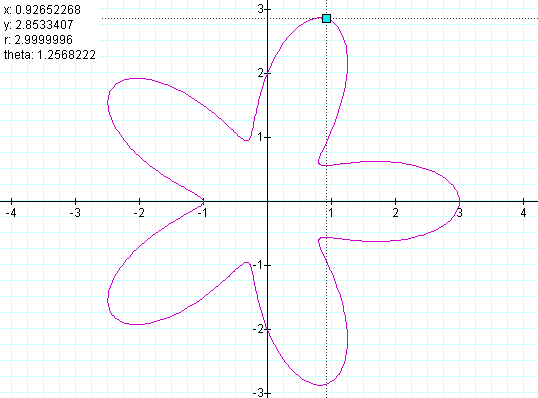
The value of q covers the loops of the leaves. When the value is less than 2p, the graph becomes incomplete for each leaf. an example is given below (k=1):
Changes/Deletion of the "a" variable:
The next graph shows the effect of removing the a variable parameter (or changing the value to 0). The first graph is for k=1, the second with k=5.
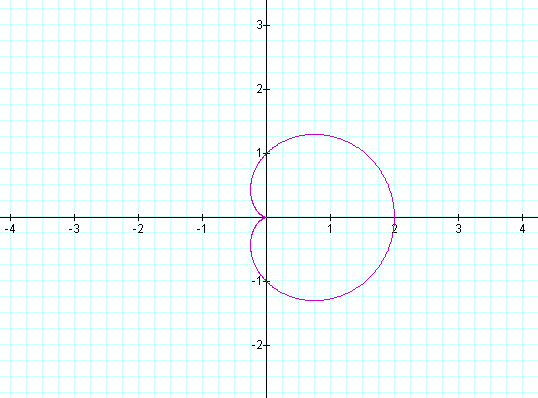
Changing the value of a to a value different from the value of b changes the graph in the following ways:
1. The maximum range of the values for r is equal to twice the sum of the values for a and b.
2. The minimum value for r is equal to the difference between the a and b.
e.g. with a = 2 and b =1, r will range to maximum of 3 and a minimum of 1.
A graph of this example is presented below.
If the value of b exceeds the value of a, the range of r still remains the difference, but instead of limiting the vertices of the leaves, the graph extends an additional leaf onto the opposite quadrant of the initial leaf. An example with b = 2 and a = 1 is given below:

Comparison with: r = b cos(kq)
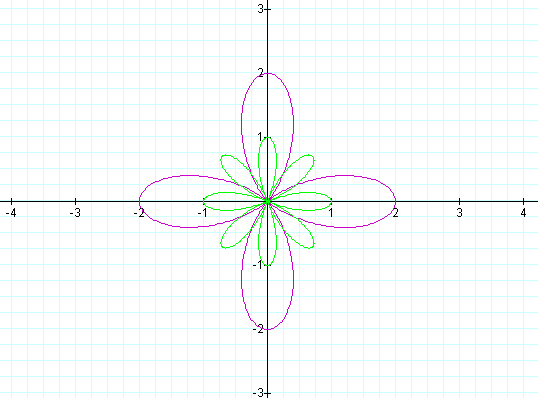
The following graph shows the differences when the "a" parameter is dropped. With k = even value, the number of "leaves" doubles when we drop the "a" parameter. When k = odd, the number of "leaves" remains the same.
Example graph with k = 4 (even)
Example graph with k = 5 (odd)
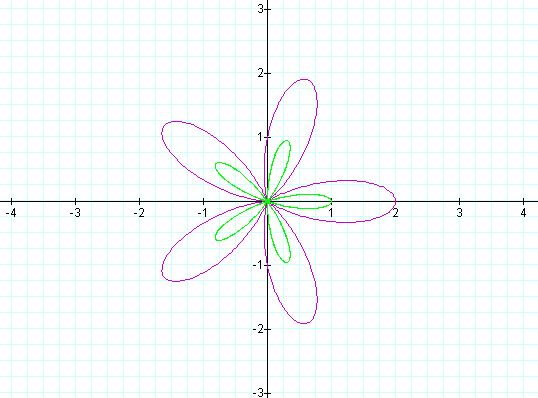
SIN vs. COS; + vs. -:
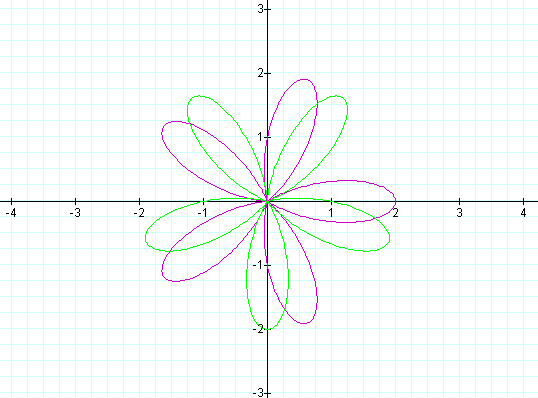
The first graph shows the affect of changing the plot to:
r = a + b sin(kq)
The original equation is plotted in purple, the new plot in green. The plot changes by rotation around counter-clockwise about the origin, by 90 degrees. Additionally, if we subtract the "cos" parameters, we will get the second chart shown here.
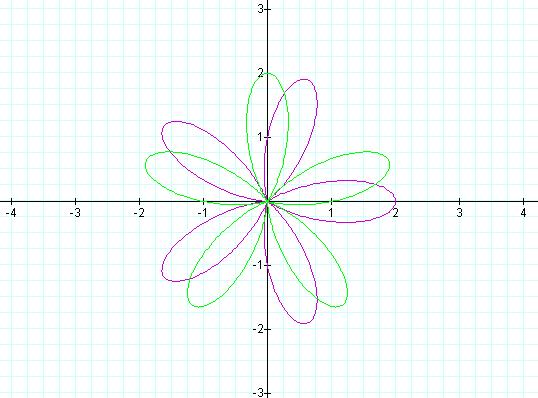
The graph below shows the following two equations, indicated in the colors noted. Please note that this plot is rotated 180 degrees counter-clockwise from the original:
Green: r = a - b cos(kq)
Purple: r = a + b cos(kq)
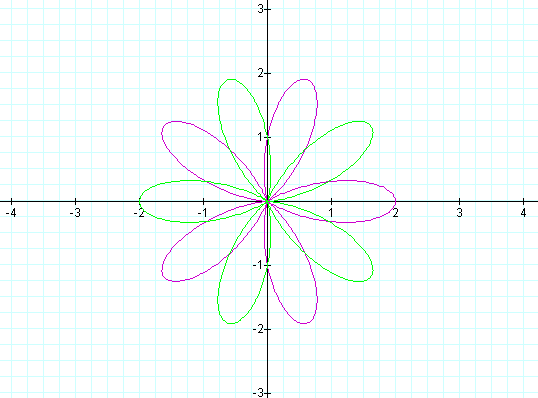
The graph below shows the following two equations, indicated in the colors noted. We rotated the original plot another 90 degrees (270 degrees in total) counter-clockwise:
Green: r = a - b sin(kq)
Purple: r = a + b cos(kq)