Assignment # 2
Fall 2002 Semester
Second Degree Equation
Problem 2- 6 : Graph
y = 2x2 + 3x - 4
i. Overlay a new graph replacing each x with (x – 4).
ii. Change the equation to move the graph into the second quadrant.
iii. Change the equation to produce a graph concave down that shares the same vertex.
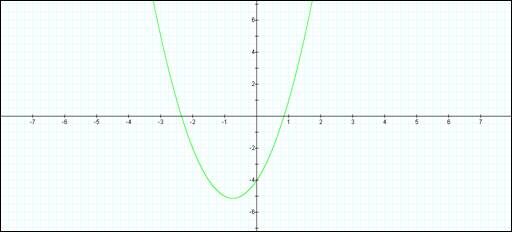
The above graph is the representation for the initial equation: y = 2x2 + 3x -4.
There is one y-intercept point (when x = 0) of -4. There are 2 solutions for x (when y =0) of ~0.85 and ~-2.35.
The vertex of the parabola created, is determined to be at x = -0.75 and y = -5.125.
i. Overlay a new graph replacing each x with (x – 4).
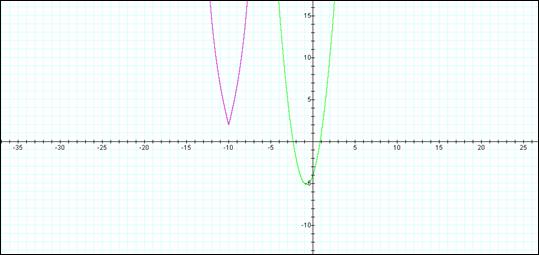
Graph of overlay of initial equation with equation replacing x by x -4. The equations plotted are:
2x2 + 3x -4 (Green)
and
2(x-4)2 + 3(x-4) -4 (Red)
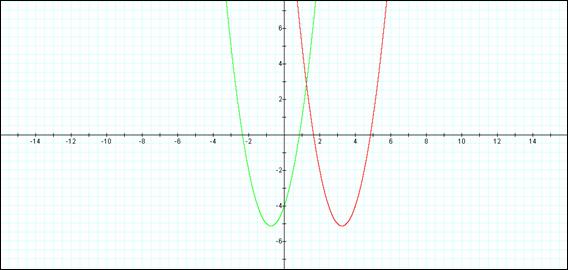
The net affect of changing from “x” to “x-4” is to shift the parabola further up the x-axis. All of the x parameter items from the initial graph are increased by 4. e.g. the vertex of the parabola is now at x = 3.25, y = 5.125.
ii . Moving the graph into the 2nd quadrant
The problem here is to adjust the parameters to provide a graph that appears in quadrant where:
y > 0
and
x < 0
From step i. it appears that all that 2 things need to be done:
e.g. y = 2(x+100)2 + 3(x+100) + 2
However, it appears that this will not work, as any increase in the value of n will eventually cross the y-axis (although usually at some point well beyond where we’re able to plot. For the purposes of demonstration, it appears to be within quadrant 2.
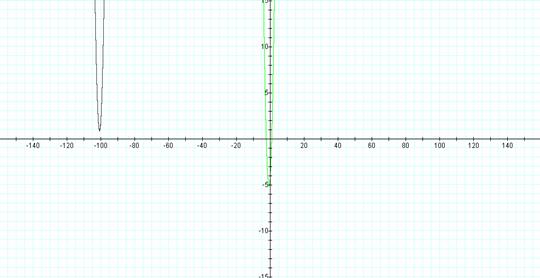
The graph below changed the equation to the following:
y = e|(-x) -10| + 3(|-x-10|) + 1
This also appears to be within the 2nd quadrant, however, as with the first, when y is large enough, there is an intersection with the y-axis (there is a solution for y when x is zero or positive.)
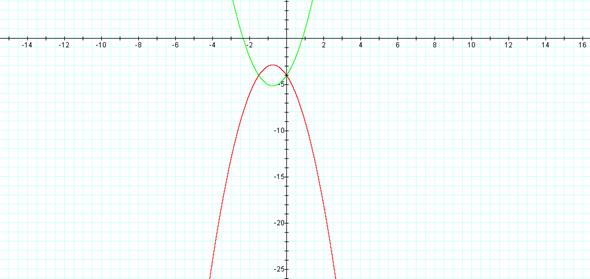
iii. The following graph is the result of changing the equation to produce a graph concave down that shares the same vertex with the first equation. The equations used are as follows:
2x2 + 3x -4 (Green)
-2x2 - 3x -6.25 (Red)
The second equation was determined by:
· Determining the vertex point of the original graph.
· Inverting the original graph’s parabola.
· Changing the y intercept parameter (-4) to match the inverted parabola.
Vertex Point Determination:
First derivative of: y = 2x2 + 3x – 4 yields ŕ y = 4x + 3.
When y = 0, the x = -0.75
For y = 2x2 + 3x – 4, when x = -0.75, then y = -5.125
Inverting the Parabola:
The parabola can be inverted, by changing the polarity of the x-parameter parts of the equation. i.e. y = 2x2 + 3x – 4 becomes -2x2 - 3x – 4.
This yields the graph below. Still not finished.
Changing the y intercept parameter (-4) to match the inverted parabola:
The y intercept needs to be changed for the new parabola. We determined the vertex point for the original graph to be at x = -0.75 and y = -5.125. These same vertex points apply to the new calculation. What is needed is to replace -4 by a variable name (e.g. “n”), and substitute the x and y values for the vertex (-0.75 and -5.125, respectively).
i.e. -5.125 = -2(-0.75)2 -3(-0.75) – n;
n = 5.125 – 1.125 + 2.25 ŕ 6.25
The final equation becomes: -2x2 - 3x - 6.25