
The Department of Mathematics Education
Assignment # 3
Fall 2002 Semester
Quadratic Equations
The Department of Mathematics Education
J. Wilson, EMAT 6680
Last modified on 14 Oct 2002 .
It has now become a rather standard exercise, with available technology, to construct graphs to consider the equation
![]()
and to overlay several graphs of
![]()
for different values of a, b, or c as the other two are held constant. From these graphs discussion of the patterns for the roots of
![]()
can be followed. For example, if we set
![]()
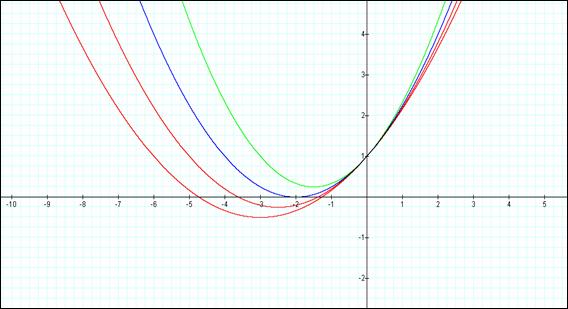
for b = -3, -2, -1, 0, 1, 2, 3, and overlay the graphs, the following picture is obtained.
We can discuss the "movement" of a parabola as b is changed. The
parabola always passes through the same point on the y-axis ( the point (0,1)
with this equation). For b < -2 the parabola will intersect the x-axis in two
points with positive x values (i.e. the original equation will have two real
roots, both positive). For b = -2, the parabola is tangent to the x-axis and so
the original equation has one real and positive root at the point of tangency.
For -2 < b < 2, the parabola does not intersect the x-axis -- the original
equation has no real roots. Similarly for b = 2 the parabola is tangent to the
x-axis (one real negative root) and for b > 2, the parabola intersects the
x-axis twice to show two negative real roots for each b.
Now consider the locus of the vertices of the set of parabolas graphed from
![]() .
.
The parabola representing the locus of the vertices can be derived from the equation through the normal means. i.e. taken the derivative of the equation - which yields a line, whose slope represents slope at any point on the parabola chosen and solving for when the slope equals zero. This yields the value of x at the vertex, from which the value of y can be derived. In this case the 1st derivative yields:
0 = 2x + b
To find the y value at the vertex, we would normally solve for x and substitute this value into the original equation. In this case, since we are looking for the equation of all the vertices, then we need to solve for b and substitute this into the original equation.
b = -2x; y = x2 +(-2x)x + 1 ŕ y = x2 - 2x2 + 1 ŕ y = -x2 + 1
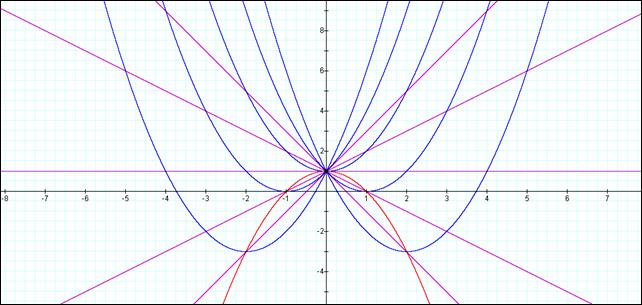
The graph below shows this parabola included with b = 3, 2, 1, 0, -1, -2, -3, as before.
y = -x2 + 1 y = x2 + bx + 1
![]()
Solving both y = -x2 + 1 and y = x2 + bx + 1 yields the lineŕ y = bx/2 + 1.
This solution ends up having one point in common when b = 0 (i.e. y = 1), and two solutions for all other selection of b. This can be seen below for cases of b = -4, -2, 0, 2, and 4.
Consider again the equation
![]()
Now graph this relation in the xb plane. We get the following graph.
If we take any particular value of b, say b = 3, and overlay this equation on the graph we add a line parallel to the x-axis. If it intersects the curve in the xb plane the intersection points correspond to the roots of the original equation for that value of b. We have the following graph.
For each value of b we select, we get a horizontal line. It is clear on a
single graph that we get two negative real roots of the original equation when b
> 2, one negative real root when b = 2, no real roots for -2 < b < 2,
One positive real root when b = -2, and two positive real roots when b < -2.
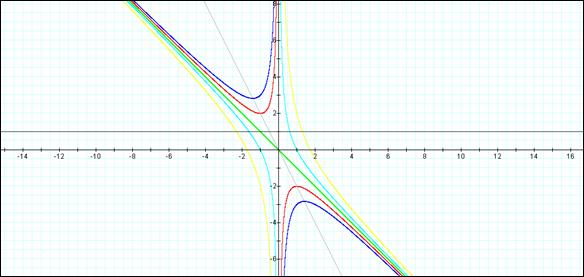
Consider the case when c = - 1 rather than + 1.
The following is a composite graph of the cases discussed previously:
BLUE ŕ x2 + yx + 2 = 0
RED ŕ
x2
+ yx + 1 = 0
GREEN ŕ
x2
+ yx + 0 = 0
L. BLUE ŕ
x2
+ yx – 1 = 0
YELLOW ŕ
x2
+ yx -3 = 0
BLACK ŕ y = n
GREY ŕ
2x + y = 0 (the
vertexes of the parabola’s
For the xa plane, the first graph shows the relationship represented by:
y = ax2 + x + 1, for a = -4,
-2, -1, 0, 1, 2
and 4.
In this case, all the parabolas
have a common point at y = 1, when x =0.
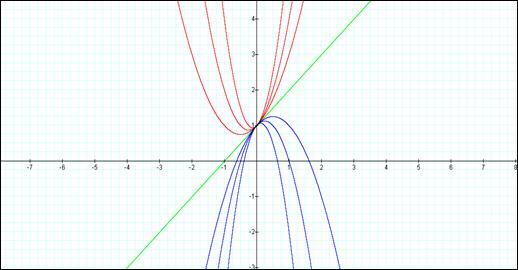
As can be seen from the plot produced, it appears that all the negative values for “a” result in a parabola shown. If we further examine smaller values of “a” (0 < a < 1) then we see that in fact when a = Ľ, y = 0 and the vertex of the parabola lies upon the x axis at -2. For smaller a’s (0 < a < Ľ). The parabola intersects the x-axis at two points. See the plot below:
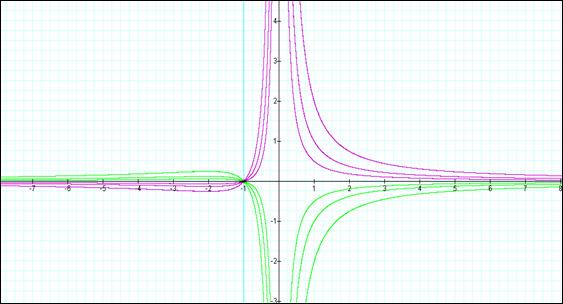
Next, let’s look at the plots of nyx2 + x + 1 = 0. These equations appear to have a common point at y = 0, x = -1. This is also a common point of intersection of the x-axis for all the plots. This is the only point of intersection with any of the axis for these sets of equations.
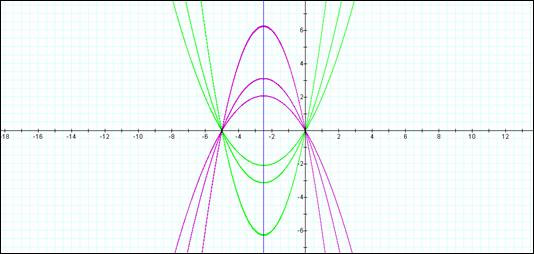
The plot below was produced to illustrate this. For the following plot:
GREEN ŕ +nyx2
+ x + 1 = 0, for n = 1, 2 and 4
PURPLE ŕ
-nyx2 + x + 1 = 0, for n = 1, 2 and
4
L. BLUE ŕ
(0)yx2 + x + 1 ŕ
x + 1 = 0
In the following example the equation
![]()
is considered. If the equation is graphed in the xc plane, it is easy to see that the curve will be a parabola. For each value of c considered, its graph will be a line crossing the parabola in 0, 1, or 2 points -- the intersections being at the roots of the original equation at that value of c. In the graph, the graph of c = 1 is shown. The equation
![]()
will have two negative roots -- approximately -0.2 and -4.8.
There is one value of c where the equation will have only 1 real root -- at c = 6.25. For c > 6.25 the equation will have no real roots and for c < 6.25 the equation will have two roots, both negative for 0 < c < 6.25, one negative and one 0 when c = 0 and one negative and one positive when c < 0.
The following graph shows: y = x2 + 5x + c for c = -3, -2, -1, 0, 1, 2, and 3.
The same type of relationship can be seen when b = 4 for any c. In this case the equation has only one real root at c = 4. For c > 4, the equation has no real roots and for c < 4, the equation will have 2 roots, both negative for 0 < c < 4. Continuing with b = 0, 1, 2 and 3 we start to see the pattern shown in the table below:
|
Value for b |
Value for c When only one real root |
Difference From previous |
|
0 |
0 |
N/A |
|
1 |
0.25 |
0.25 |
|
2 |
1.0 |
0.75 |
|
3 |
2.25 |
1.25 |
|
4 |
4 |
1.75 |
|
5 |
6.25 |
2.25 |
The relationship between “b” and “c” can be therefore be seen as : c = b2/4
Send e-mail to jwilson@coe.uga.edu or ckolodzy@uga.edu
Return to Carl's Home Page