Para-Fun
Fun with Parametric
Curves
 In this exploration,
I am investigating parametric curves involving sin and cos. I
am first looking at
x = a cos(t)
y = b sin(t)
where a = b, a <
b, and a > b.
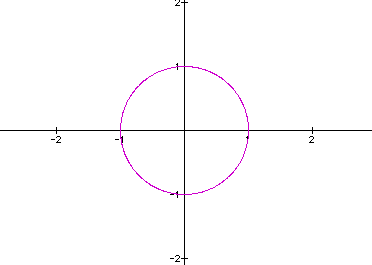
It did not take many
examples discover that when a = b, the graph is a circle with
radius =1 centered about the origin. Here, I have shown where
a = b = 1.
In this exploration,
I am investigating parametric curves involving sin and cos. I
am first looking at
x = a cos(t)
y = b sin(t)
where a = b, a <
b, and a > b.
It did not take many
examples discover that when a = b, the graph is a circle with
radius =1 centered about the origin. Here, I have shown where
a = b = 1.
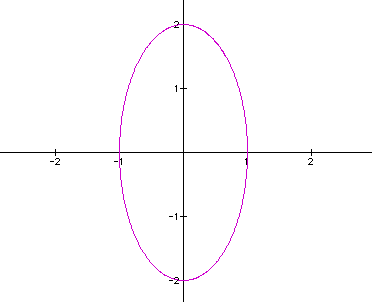
 When a < b (a =
1 and b = 2), the graph is an ellipse centered about the origin
where our vertical distance from the center is 2 and the horizontal
distance from the center is 1. This gives insight in that the
a = horizontal distance from the center of the ellipse and b =
vertical distance from the center of the ellipse.
When a < b (a =
1 and b = 2), the graph is an ellipse centered about the origin
where our vertical distance from the center is 2 and the horizontal
distance from the center is 1. This gives insight in that the
a = horizontal distance from the center of the ellipse and b =
vertical distance from the center of the ellipse.
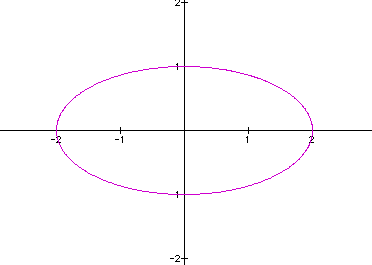
 This leads me to believe
that when a = 2 and b = 1 (a > b), I will get a graph of an
ellipse with a horizontal distance of 2 (a) from the center and
a vertical distance of 1 (b).
This leads me to believe
that when a = 2 and b = 1 (a > b), I will get a graph of an
ellipse with a horizontal distance of 2 (a) from the center and
a vertical distance of 1 (b).
 Next, I want to see
what happens when the sin and cos are squared in:
x = a (cos(t))^2
y = b (sin(t))^2
where a = b, a <
b, and a > b.
If a = b (=2), we have
a graph that looks like this:
Next, I want to see
what happens when the sin and cos are squared in:
x = a (cos(t))^2
y = b (sin(t))^2
where a = b, a <
b, and a > b.
If a = b (=2), we have
a graph that looks like this:
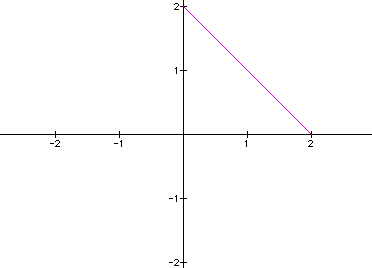 This is not at all
what I was expecting. I was expecting to see some sort of graph
with a loop -- not a straight line. Since a = b = 2 and the x-intercept
= y-intercept = 2, we may be able to deduce that the a = x-intercept
(because a represented the horizontal distance on the previous
example) and b = y-intercept (because b represented the vertical
distance on the previous example). It does not surprise me that
the entire graph sits in quadrant I because you are squaring a
value and then multiplying by a positive number. Therefore, if
a = b = -#, the graph will lie entirely in quadrant III where
all values are negative because after squaring, you will have
a positive value multiplied by a negative number. Let's check
to make sure. The following graph is a = b= -2.
This is not at all
what I was expecting. I was expecting to see some sort of graph
with a loop -- not a straight line. Since a = b = 2 and the x-intercept
= y-intercept = 2, we may be able to deduce that the a = x-intercept
(because a represented the horizontal distance on the previous
example) and b = y-intercept (because b represented the vertical
distance on the previous example). It does not surprise me that
the entire graph sits in quadrant I because you are squaring a
value and then multiplying by a positive number. Therefore, if
a = b = -#, the graph will lie entirely in quadrant III where
all values are negative because after squaring, you will have
a positive value multiplied by a negative number. Let's check
to make sure. The following graph is a = b= -2.
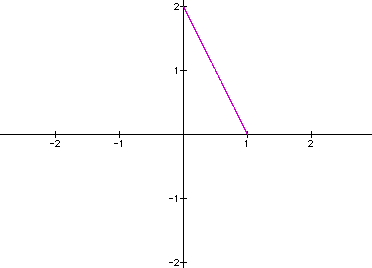
 Nothing surprising
there. Now, let's check my conjecture about a = x-intercept and
b = y-intercept. In the following graph, I let a = 1 and b = 2.
This graph should rest in quadrant I due to all values being positive
and the x-intercept should equal 1 and the y-intercept should
equal 2.
Nothing surprising
there. Now, let's check my conjecture about a = x-intercept and
b = y-intercept. In the following graph, I let a = 1 and b = 2.
This graph should rest in quadrant I due to all values being positive
and the x-intercept should equal 1 and the y-intercept should
equal 2.
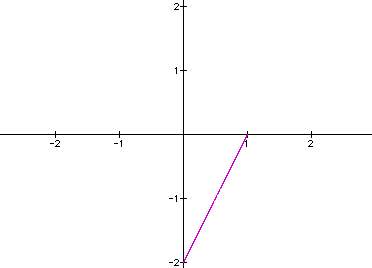
 Again, nothing new
and nothing surprising. What if a is positive and b is negative?
Where will the graph lie? Our x-value will be positive and the
y-value will be negative, leading us to believe that this will
lie in quadrant IV. Let's see where a = 1 and b = -2.
Again, nothing new
and nothing surprising. What if a is positive and b is negative?
Where will the graph lie? Our x-value will be positive and the
y-value will be negative, leading us to believe that this will
lie in quadrant IV. Let's see where a = 1 and b = -2.
 WOW! I am really on
today! Let's move on to cubing the sin and cos. Will it make another
circle/ellipse? Or will it have other fun loops? Let's look at:
x = a (cos(t))^3
y = b (sin(t))^3
where a = b = 1.
WOW! I am really on
today! Let's move on to cubing the sin and cos. Will it make another
circle/ellipse? Or will it have other fun loops? Let's look at:
x = a (cos(t))^3
y = b (sin(t))^3
where a = b = 1.
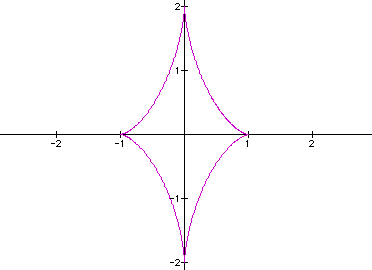
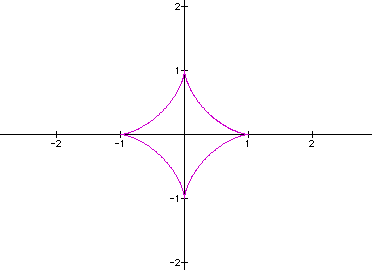 OK! This is finally
fun! I promised you fun in the title and we are finally there!
So if a = b = 2, will we have the same shape stretched out to
2 units on each side of the center?
OK! This is finally
fun! I promised you fun in the title and we are finally there!
So if a = b = 2, will we have the same shape stretched out to
2 units on each side of the center?
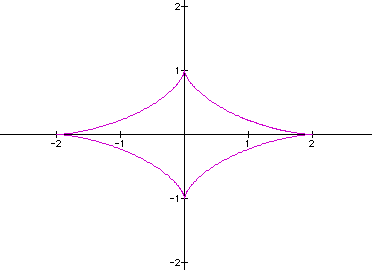
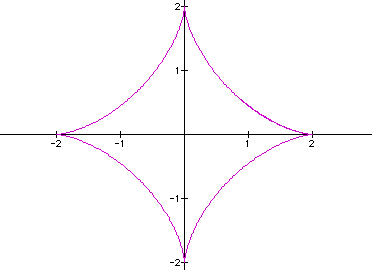 This is getting cool!
What if a < b or a > b? Let a = 1 and b = 2 and then switch
the values. I think that our diamond will extend from -1 to 1
on the x-axis and from -2 to 2 on the y-axis when a = 1 and b
= 2. I think that our diamond will extend from -2 to 2 on the
x-axis and from -1 to 1 on the y-axis when a = 2 and b = 1.Let's
see!
This is getting cool!
What if a < b or a > b? Let a = 1 and b = 2 and then switch
the values. I think that our diamond will extend from -1 to 1
on the x-axis and from -2 to 2 on the y-axis when a = 1 and b
= 2. I think that our diamond will extend from -2 to 2 on the
x-axis and from -1 to 1 on the y-axis when a = 2 and b = 1.Let's
see!
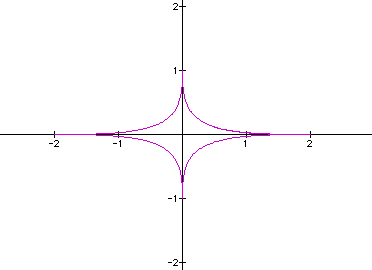
 Due to the fact that
cubes can be positive or negative, it won't matter if a and/or
b is negative because the negative values will still come up and
the positive values will still come up -- just in a different
"order" in a t-table. However, order does not matter
when you are plotting points. This has me interested in raising
sin and cos to the forth power and the fifth power! Will all even
powers lead to that boring straight line? Will odd powers lead
to other interesting diamond like figures?
For a = 2 and b = 1
in
x = a (cos(t))^4
y = b (sin(t))^4
we get the graph:
Due to the fact that
cubes can be positive or negative, it won't matter if a and/or
b is negative because the negative values will still come up and
the positive values will still come up -- just in a different
"order" in a t-table. However, order does not matter
when you are plotting points. This has me interested in raising
sin and cos to the forth power and the fifth power! Will all even
powers lead to that boring straight line? Will odd powers lead
to other interesting diamond like figures?
For a = 2 and b = 1
in
x = a (cos(t))^4
y = b (sin(t))^4
we get the graph:
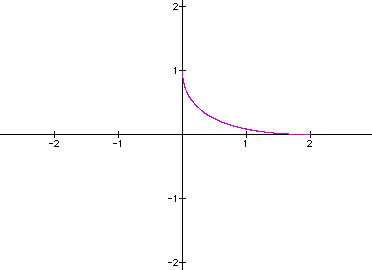 Not a boring straight
line, but close! It appears as if the line is being pulled in
by the center (the origin) when the power is even. What if the
power was 10?
Not a boring straight
line, but close! It appears as if the line is being pulled in
by the center (the origin) when the power is even. What if the
power was 10?
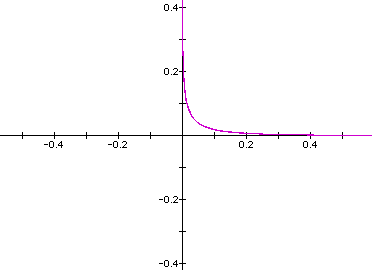 Note the change in
the scale on the axes. If we pick an even power big enough, our
graph will soon resemble a right angle. What if the power was
50?
Note the change in
the scale on the axes. If we pick an even power big enough, our
graph will soon resemble a right angle. What if the power was
50?
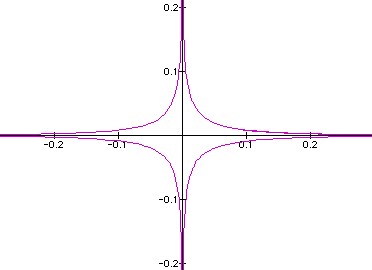
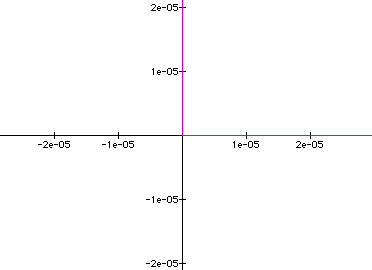 Look how small the
values on the axes are and the graph still looks like a right
angle!
For odd powers, we
will have diamond shapes.
For a = 2 and b = 1
in
x = a (cos(t))^5
y = b (sin(t))^5
we get the graph:
Look how small the
values on the axes are and the graph still looks like a right
angle!
For odd powers, we
will have diamond shapes.
For a = 2 and b = 1
in
x = a (cos(t))^5
y = b (sin(t))^5
we get the graph:
 Our diamond is sinking
in closer and closer to the center (the origin) for odd powers.
What if the power was 11?
Our diamond is sinking
in closer and closer to the center (the origin) for odd powers.
What if the power was 11?
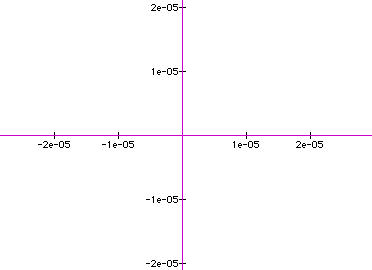
 What if the power was
49? Will it be sucked into the axes and look like nothing is there
beside the color on the axes?
What if the power was
49? Will it be sucked into the axes and look like nothing is there
beside the color on the axes?
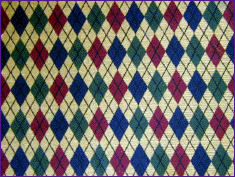
 Truly remarkable! This
has been a fun exercise. Again, not to worry, there is plenty
more where this came from!
Truly remarkable! This
has been a fun exercise. Again, not to worry, there is plenty
more where this came from!
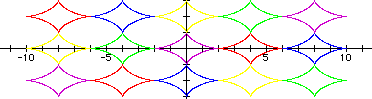
 Kind of reminds me of Argyle socks!
Return