
After extensive work is done on linear equations, students are exposed to quadratic expressions and equations in Algebra I, usually in 8th or 9th grade. This concept is usually first addressed in graphic form where students learn that its general shape is a parabola and the concepts of vertex, axis of symmetry, and roots are also discussed. Students then usually receive more practice on making t-tables where they pick arbitrary values for x and solve for y just like when they were studying linear equations. Students also receive a lot of practice drawing coordinate planes where they graph these parabolas and will eventually discover some other properties of quadratics like shifts and contractions. It has now become a rather standard exercise to construct these graphs using available technology like graphing calculators or the graphing calculator software. Students are able to make several connections by overlaying several graphs of
for different values of a, b, or c as the other two are held constant.
From these graphs, discussion of the root patterns may follow. For example, if we allow a = c = 1, we have
for b = -3, -2, -1, 0, 1, 2, 3, and overlay
the graphs, the following picture is obtained.
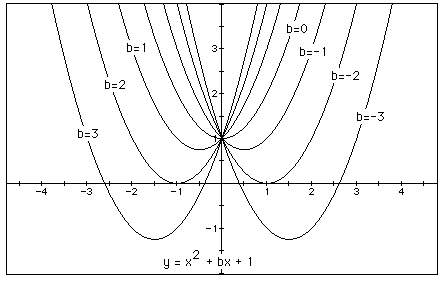
We can discuss the "movement" of
a parabola as b is changed. The parabola always passes through
the same point on the y-axis ( the point (0,1) with this equation).
For b < -2 the parabola will intersect the x-axis in two points
with positive x values (i.e. the original equation will have two
real roots, both positive). For b = -2 and b = 2, the parabola
is tangent to the x-axis giving one real root at the point of
tangency, positive and negative, respectively. For -2 < b <
2, the parabola does not intersect the x-axis giving no real roots.
For b > 2, the parabola intersects the x-axis twice to show
two negative real roots for each b. This would be a great investigation
for students in changing the value of c while keeping the value
of a = 1 and b = -3, -2, ..., 2, 3 to make generalizations about
the roots. Then they can change the value of a while b stays the
same and c = 1 to see if their conjectures hold.
Now, we consider the locus of the vertices of the set of parabolas
graphed from
This locus forms a parabola with its vertex at (0,1) and its roots at (-1,0) and (1,0) allowing it to take the form:
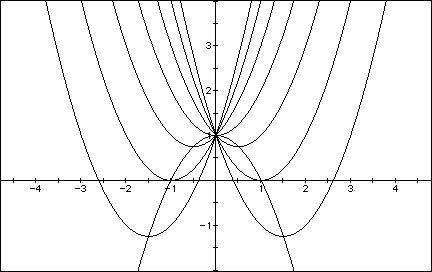
Does this necessarily tell us anything? Will the equation of the locus of the vertices always have b = 0? Will the a value always be -1? Is it coincidental that c = 1? Again, this leads to another great investigation. Graph the set of parabolas where c = 2 to find out if the equation of the locus of the vertices is
Our conjecture is true in this case, but will it always work?
We are now going to look at these graphs from a very different perspective. Instead of looking at the graphs in the standard xy plane, we will look at the xb plane. Here, we look at b as if it is the y. Therefore, we solve the equation for b and graph. Consider again the equation
Now graph this relation in the xb plane where
This leads to the following graph:
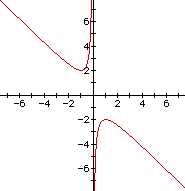
If we take any particular value of b, say b
= 5, and overlay this equation on the graph we add a line parallel
to the x-axis. If the line intersects the curve in the xb plane,
the intersection points correspond to the roots of the original
equation for that value of b, giving the following graph:
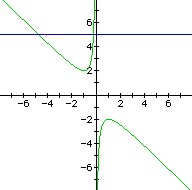
For each value of b we select, we get a horizontal line. It is clear on a single graph that we have the following:
Consider the case when c = - 1 rather than + 1.
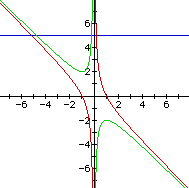
This will always give two real roots where one is positive and one is negative. This leads to another wonderful investigation.
In this paper we have looked only at graphing quadratic equations in the standard xy plane and the new idea of the xb plane. The xb plane gives us a totally different perspective of the graph and its roots. There are other planes that should be considered in these investigations: the xa plane and the xc plane. In the xa plane, allow b and c to be held constant and vary the values for a. In the xc plane, allow a and b to be held constant and vary the values for c. There are some very interesting relationships that appear.