4. Generate a Fibonnaci sequence in the first column using f(0) = 1, f(1) = 1,
f(n) = f(n-1) + f(n-2)
.
a. Construct the ratio of each pair of adjacent terms in the Fibonnaci sequence. What happens as n increases? What about the ratio of every second term? etc.
b. Explore
sequences where f(0) and f(1) are some arbitrary integers other
than 1. If f(0)=1 and f(1) = 3, then your sequence is a Lucas
Sequence. All such sequences, however,
have the same limit of the ratio of successive terms.
The following is the fibonacci sequnce demonstrated on excel:
| The Fibonacci | Sequence | ||
| term# | term in seq | ratio1 | ratio2 |
| 1 | 1 | ||
| 2 | 1 | 1 | |
| 3 | 2 | 2 | 2 |
| 4 | 3 | 1.5 | 3 |
| 5 | 5 | 1.66666666666667 | 2.5 |
| 6 | 8 | 1.6 | 2.66666666666667 |
| 7 | 13 | 1.625 | 2.6 |
| 8 | 21 | 1.61538461538462 | 2.625 |
| 9 | 34 | 1.61904761904762 | 2.61538461538462 |
| 10 | 55 | 1.61764705882353 | 2.61904761904762 |
| 11 | 89 | 1.61818181818182 | 2.61764705882353 |
| 12 | 144 | 1.61797752808989 | 2.61818181818182 |
| 13 | 233 | 1.61805555555556 | 2.61797752808989 |
| 14 | 377 | 1.61802575107296 | 2.61805555555556 |
| 15 | 610 | 1.61803713527851 | 2.61802575107296 |
| 16 | 987 | 1.61803278688525 | 2.61803713527851 |
| 17 | 1597 | 1.61803444782168 | 2.61803278688525 |
| 18 | 2584 | 1.61803381340013 | 2.61803444782168 |
| 19 | 4181 | 1.61803405572755 | 2.61803381340013 |
| 20 | 6765 | 1.61803396316671 | 2.61803405572755 |
| 21 | 10946 | 1.6180339985218 | 2.61803396316671 |
| 22 | 17711 | 1.61803398501736 | 2.6180339985218 |
| 23 | 28657 | 1.6180339901756 | 2.61803398501736 |
| 24 | 46368 | 1.61803398820532 | 2.6180339901756 |
| 25 | 75025 | 1.6180339889579 | 2.61803398820533 |
| 26 | 121393 | 1.61803398867044 | 2.6180339889579 |
| 27 | 196418 | 1.61803398878024 | 2.61803398867044 |
| 28 | 317811 | 1.6180339887383 | 2.61803398878024 |
| 29 | 514229 | 1.61803398875432 | 2.6180339887383 |
| 30 | 832040 | 1.6180339887482 | 2.61803398875432 |
| 31 | 1346269 | 1.61803398875054 | 2.6180339887482 |
| 32 | 2178309 | 1.61803398874965 | 2.61803398875054 |
| 33 | 3524578 | 1.61803398874999 | 2.61803398874965 |
| 34 | 5702887 | 1.61803398874986 | 2.61803398874999 |
| 35 | 9227465 | 1.61803398874991 | 2.61803398874986 |
The second column displays each term in the sequence. The third column describes the ratio of consecutive terms. The fourth column is the ratio of every other term.
Looking at the list of ratios, I did not see a pattern or any interesting generalization. As the number of terms increase, the ratios level off at about 1.618 for the ratio of consecutive terms and level off around 2.618 for the ratio of every other term.

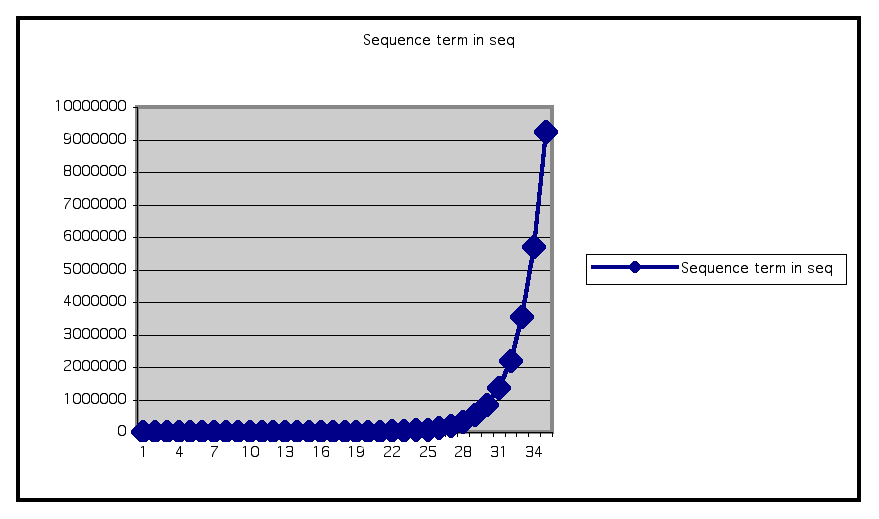
I graphed the Fibonaccci sequence in Excel and found that the sequence resembles the exponential. We can see from the graph, that the the rate of change greatly increases as n gets larger, by observing the approximate distance between consecutive points as the x values increase.

Above is a graph of the ratios of the consecutive terms of the Fibonacci sequence. We can see that there is an initial jump between the first two points and then an immediate decrease. Around the 9th term, the sequence appears to be constant. We can see this in the excel chart as the terms eventually level off around 1.618.

Above is the graph of the ratio of every other term. The graphs of the ratios of terms look very similar. In the second graph, we see the same large jump from the first ratio to the second and then a sharp decrease with the graph leveling off around term 7 at about 2.6.
Now, lets take a look at some other sequences that look like Fibonacci's sequence but begin with other numbers. For example, if we change f(0)=1 and f(1)=3, we form what is termed the Lewis sequence. The first 20 terms of thesequence are:
| term # | term in Lewis sequence |
| 1 | 1 |
| 2 | 3 |
| 3 | 4 |
| 4 | 7 |
| 5 | 11 |
| 6 | 18 |
| 7 | 29 |
| 8 | 47 |
| 9 | 76 |
| 10 | 123 |
| 11 | 199 |
| 12 | 322 |
| 13 | 521 |
| 14 | 843 |
| 15 | 1364 |
| 16 | 2207 |
| 17 | 3571 |
| 18 | 5778 |
| 19 | 9349 |
| 20 | 15127 |
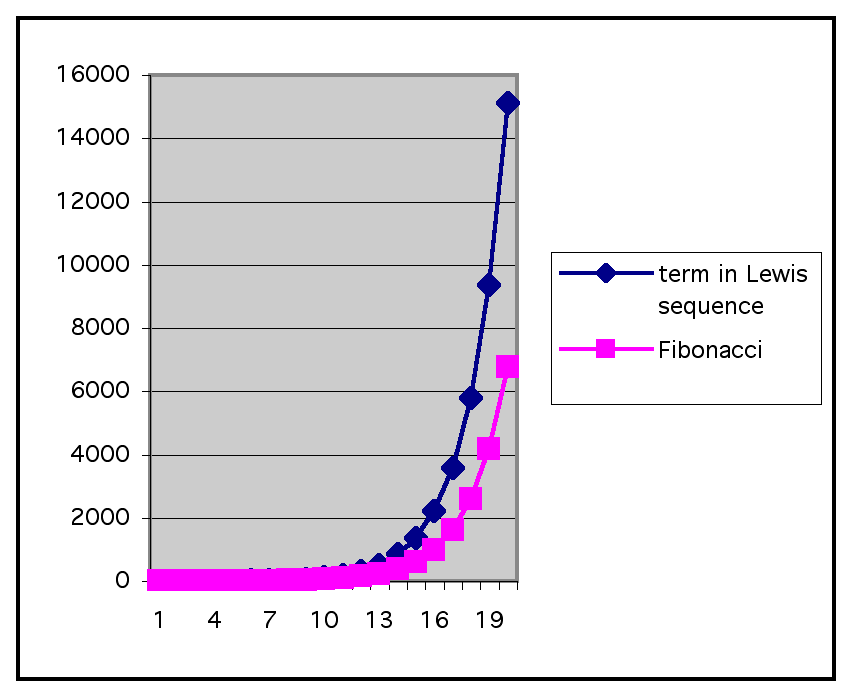
If we graph the Lewis sequence and compare the graph to the Fibonacci sequence, we have:

With the Fibonacci sequence in purple and the Lewis sequence in blue. We can see that the Lewis sequence has a much steeper slope than the Fibonacci sequence, as n gets larger. However as n is smaller, the two sequences look about the same.

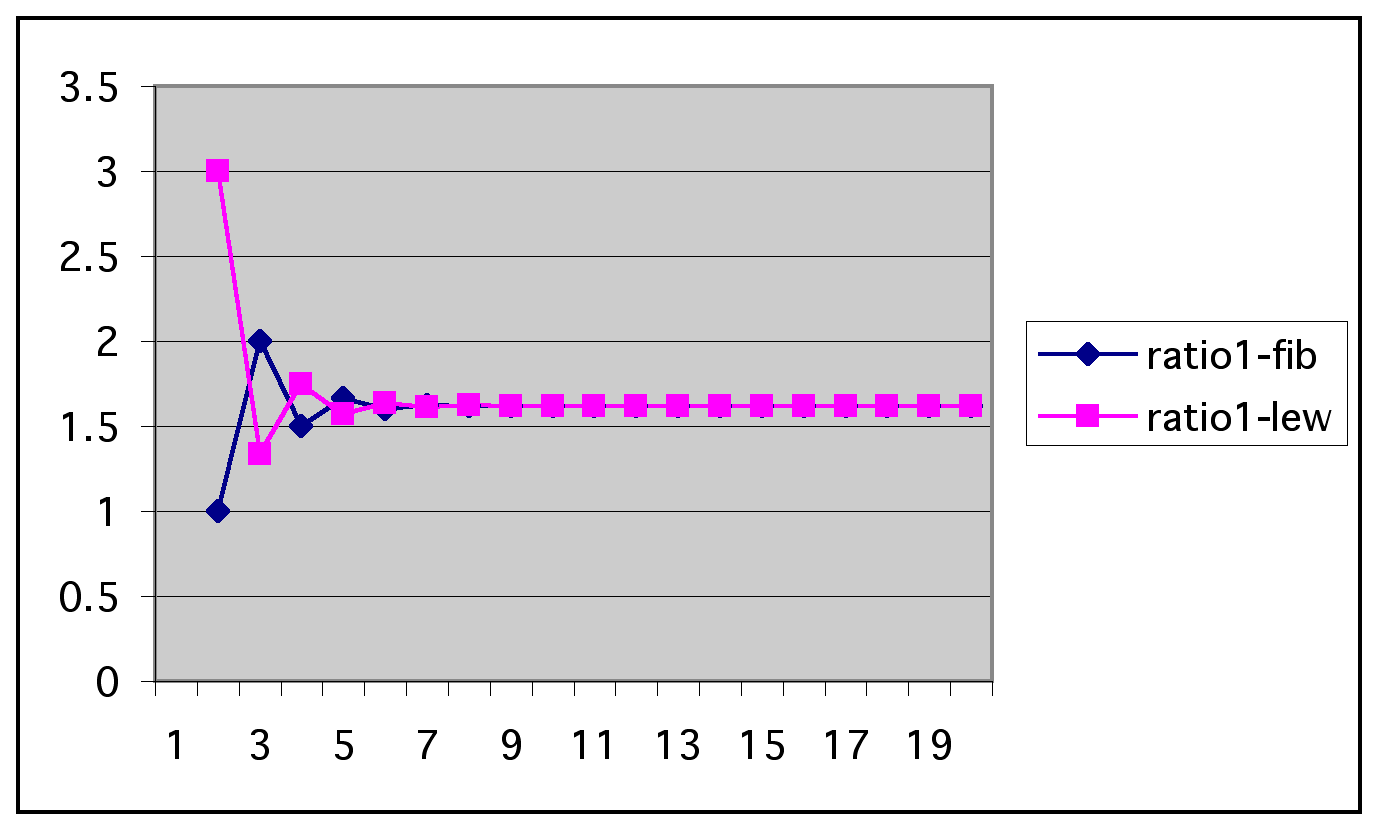
Above is the graphs of the ratios of consecutive terms for both sequences. The Fibonacci sequence is in blue and the Lewis sequence is in purple. It is interesting that for the first few points on the graph, the graphs appear to be reflections of each other, and finally becoming the same function as the graph continues.
The following is the first few terms of the sequence with f(0) = 2 and
f(1) =4. Its graph is compared with the Fibonacci sequence, as well.
| term # | |
| 1 | 2 |
| 2 | 4 |
| 3 | 6 |
| 4 | 10 |
| 5 | 16 |
| 6 | 26 |
| 7 | 42 |
| 8 | 68 |
| 9 | 110 |
| 10 | 178 |
| 11 | 288 |
| 12 | 466 |
| 13 | 754 |
| 14 | 1220 |
| 15 | 1974 |
| 16 | 3194 |
| 17 | 5168 |
| 18 | 8362 |
| 19 | 13530 |
| 20 | 21892 |

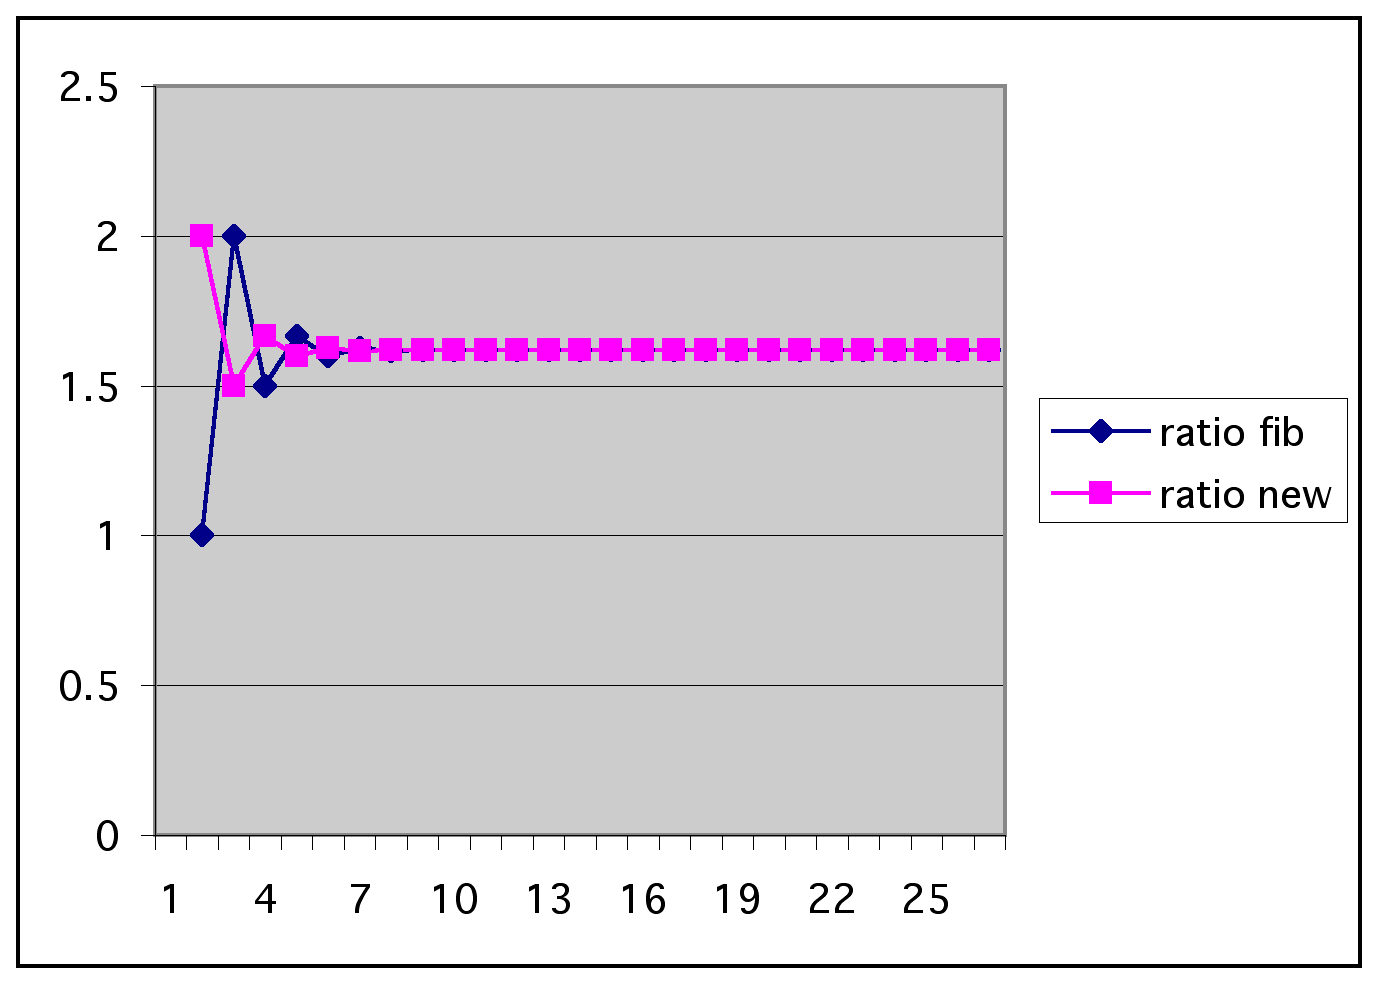
Above is the graph of the ratio of consecutive terms for each of the sequences. The fibonacci sequence is in blue and the new sequence is in purple. Again, we can see that after the first couple of ratios, the two graphs are identical, staying constant near 1.61. It is pretty safe to guess that any recursive sequence, in which you add the two previous terms to get the next, will follow this pattern.
In the following spread sheet, you can enter the first two terms of your fibonacci-like sequence and see that the ratios of the consecutive terms will eventually become 1.61.
Now, lets try a sequence of terms where you subtract the previous two terms to find the next term. The first two terms are 1,000 and 5.
| Sequence | ratio of terms |
| 1000 | |
| 5 | 0.005 |
| 995 | 199 |
| -990 | -0.994974874371859 |
| 1985 | -2.00505050505051 |
| -2975 | -1.49874055415617 |
| 4960 | -1.6672268907563 |
| -7935 | -1.59979838709677 |
| 12895 | -1.62507876496534 |
| -20830 | -1.61535478867778 |
| 33725 | -1.61905904944791 |
| -54555 | -1.61764269829503 |
| 88280 | -1.61818348455687 |
| -142835 | -1.6179768917082 |
| 231115 | -1.61805579864879 |
| -373950 | -1.6180256582221 |
| 605065 | -1.61803717074475 |
| -979015 | -1.6180327733384 |
| 1584080 | -1.61803445299612 |
| -2563095 | -1.61803381142367 |
| 4147175 | -1.61803405648249 |
| -6710270 | -1.61803396287834 |
| 10857445 | -1.61803399863195 |
Again, as n gets larger, the sequence tends to -1.618, as we expect it to do.
What I learned: That regardless of the first two terms of a fibonacci sequence, the ratio of consecutive terms will tend to 1.618. If we change the sequence to subtraction of consecutive terms, the ratio of consecutive terms will tend to -1.618.
Things to explore: Why is this the case?