
Lesson
5:
Hyperbolas
By
Carly Coffman
Let’s start
our exploration of hyperbolas by first exploring h and k. Since we have explored these variables in the
previous lessons, you will have a link with a given equation where you have to
substitute values for h and k. Remember
you can also use the “n” button on the bottom of the window to explore the
variables. Have fun! Exploration 1
Open a
Microsoft Word document, title it “Hyperbolas” and type your name and date
under the title. Answer all questions
using complete sentences on your Word document.
1)
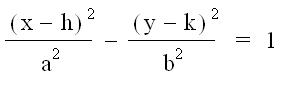
In the
equations, and , what do h
and k represent? (You can copy and paste each equation into your Word document)
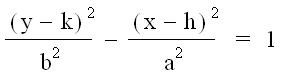
Now, let’s
explore a and b. In the following
exploration, click on the play button at the bottom to change the values for
a. Exploration 2
2)
As a
increases, what happens to the graph of the hyperbola?
Let’s explore
b now, by clicking on the play button at the bottom of the next window.
3)
What affect
does b have on the graph of the hyperbola?
Let’s look
into these values a bit further. Look at
the following hyperbola graphs.
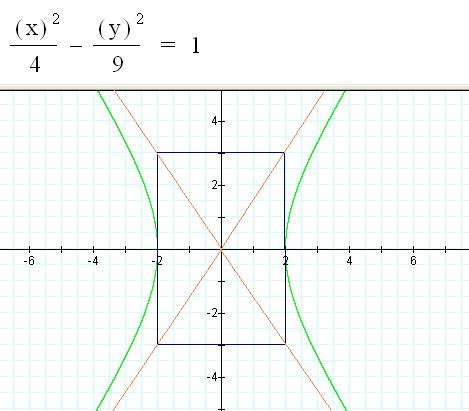
The line from
(-2,0) to (2,0) is called the transverse
axis since it connects the two vertices
(-2,0) and (2,0). Notice that from the
center (0,0) to each vertex there is a distance of 2. The line from (3,0) to (-3,0) is called the conjugate axis. Notice that from the center to (3,0) there is
a distance of 3.
4) So, how
do these distances on each axis relate to a^2 and b^2?
The asymptotes
of the hyperbola (which are shown in brown) are formed by creating the
diagonals of the rectangle formed by the transverse and conjugate axis. The
equations of the asymptotes depend on the orientation of the transverse axis.
Ø
If the
transverse axis is horizontal, the asymptotes are
y
= (b/a)x and y = -(b/a)x
Ø
If the
transverse axis is vertical, the asymptotes are
y
= (a/b)x and y = -(a/b)x
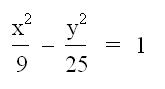
5)
So, what are
the asymptotes for the equation 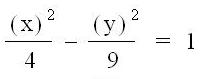 (graph
above)?
6)
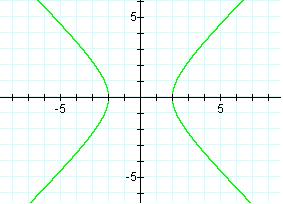
As a
increases, what happens to the graph of a hyperbola with a horizontal
transverse axis? (Press the play button to view a^2 increasing.) Exploration 4
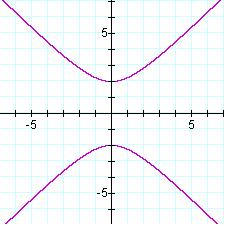
7) What
happens to the graph of a hyperbola with a vertical transverse axis when a
increases?
Exploration 5
Now, let’s
put all of the information we have learned together.
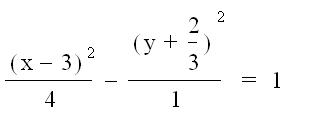
For each of
the following equations find the center of the graph and the equations of the
asymptotes.
8) 
9)
10)
Print your
Word document and place it in your portfolio or notebook with our other
investigations. Congratulations, you are finished with the
hyperbola lesson!
Return to Home Page Next
Lesson