Lesson 4:
Parabolas
By Carly
Coffman
![]()
Or
![]()
Definitions:
Ø
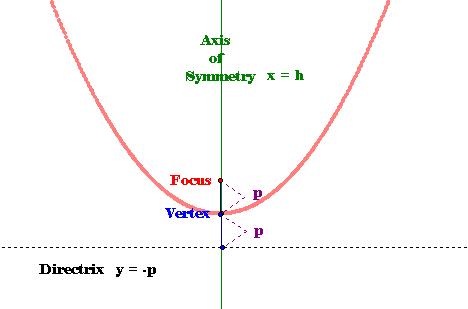
A parabola is the set of
all points (x,y) in a plane that are equidistant from a fixed line, the
directrix, and a fixed point, the focus, not on the line.
Ø
The vertex is the midpoint
between the focus and the directrix.
Ø
The axis of the parabola
(or axis of symmetry) is the line passing through the focus and the vertex.
Look at the creation of a
parabola (you must have GSP to see this link):
Parabola
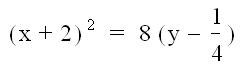
Let’s explore the parabola
a bit. In the equation, ![]() , let’s
look at the affect h and k have on the graph.
, let’s
look at the affect h and k have on the graph.
1) Do you have any predictions as to what increasing h and k will do
to the graph?
*Remember to respond in complete sentences.
Let’s see if you were on
target or not. Click on the play button
at the bottom of the window. Exploration 1
2)
What is the relationship
between h and the parabola graph?
Now, let’s test what k
does to the graph. Click on the play
button at the bottom of the window. Exploration 2
3)
What is the relationship
between k and the parabola graph?
Now you should be able to
tell where the vertex of each of the following parabolas lies. State the vertex of each parabola in a
complete sentence. Copy and paste the equation into your Word document.
4)
![]()
5)
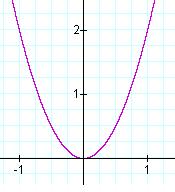
Notice also that all of
the equations we have worked with so far have had the x term squared. Each one of these graphs has been concave up,
which means the vertex is the minimum point on the y-axis and the graph looks
like a smiley face.
6)
What do you think would
happen if there was a negative sign in front of the parenthesis of the
x-term?
Let’s see if your
prediction was correct. Exploration 3
7)
Was your prediction
correct? How did the negative sign
affect the graph?
When the vertex is the
maximum point on the graph, the graph is concave down. These parabolas look like a frown.
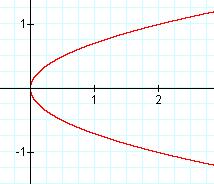
Let’s see what happens
when the y-term is squared.
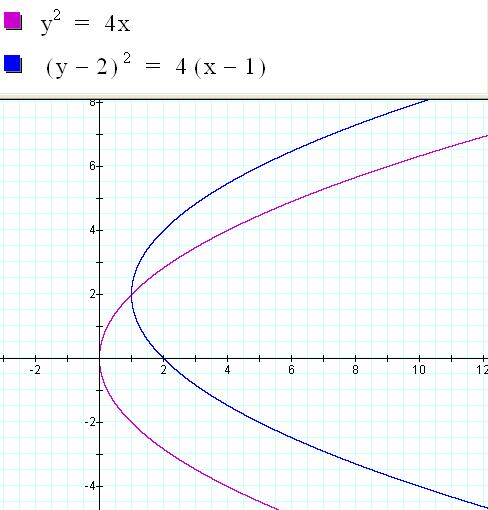
State the vertex and axis
of symmetry of the following parabolas.
Remember the axis of symmetry is the equation of the line of symmetry
for each parabola.
8) 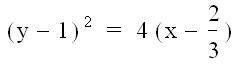
9) ![]()
10)
What do you predict will
happen to the parabolas above when a negative sign is placed in front of the
parenthesis for the y-term? Test your
prediction and tell whether or not your prediction was correct.
Now, we have one last
aspect of parabolas to explore. The last
aspect is the value of p in each parabola equation. In most of the equations
above, p has been one.
11)
What do you think p
affects on the graph of a parabola? (take a guess if you do not know)
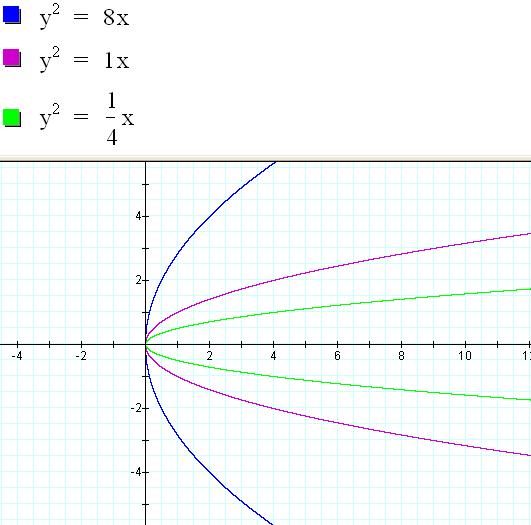
Remember, the coefficient
of x is 4p. So, in order to get the
value of p we must divide the coefficient of x by 4. The first p is 2, the second p is ¼ and the
third p is 1/16.
12)
As p decreases, what
happens to the graph of the parabola?
We have finished exploring
the variables of parabolic equations. Print
your Word document and file it with your other conic explorations.
Congratulations
you have finished your parabola exploration!
Return to Home Page Next
Lesson