

First we will look at the graph of
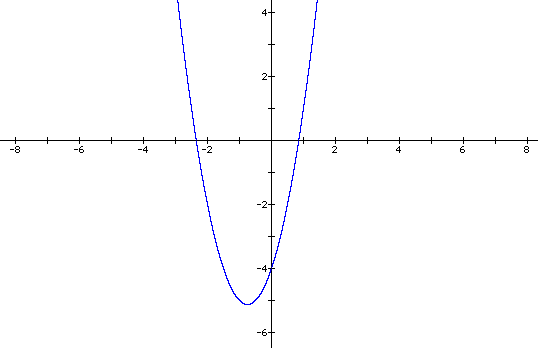
On the following graphs, I will leave the original equation in blue and use red for the adjusted equations.
Next, we will replace each x with (x-4). This gives the following equation and graph.
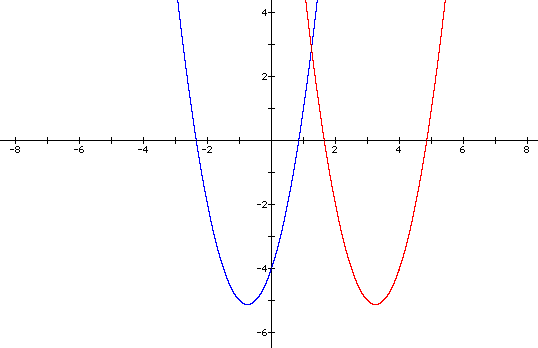
We see that the graph has shifted 4 units to the right. By replacing x with (x-4), we have, in effect, changed the input value for our function before performing any operations on it. For example, plugging x = 1 into the second equation gives the same result as plugging x = -3 into the original equation. We would expect to get a graph with the same shape just shifted to the right.
If we want to shift the graph up or down, we use a similar process. Shifting up or down means adjusting our y-values. This means adjusting the output values of our function. We can do this by adding or subtracting after all other operations have been performed. For example, if we add 3 to our original equation, we would expect to see the graph shift up three units. The graph follows.
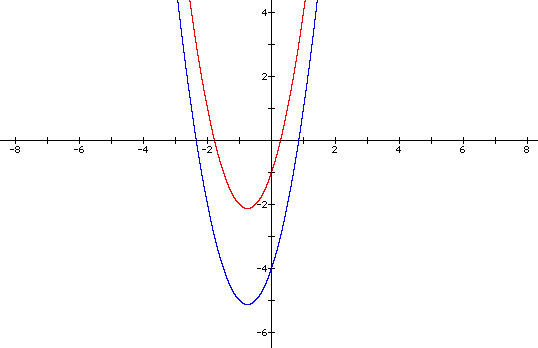
If we can shift our graph up, down, left, and right, then we should be able to place our graph anywhere in the coordinate plane that we desire.
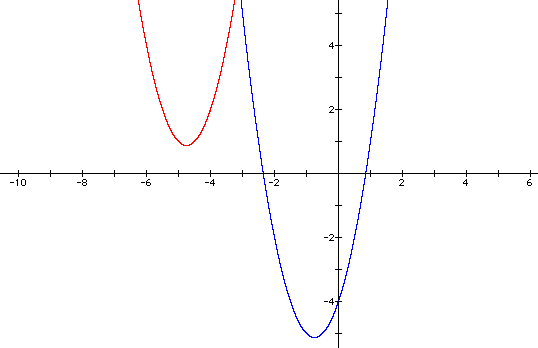
Suppose we want to place our graph in the second quadrant. The second quadrant is the one in the upper left. To move the blue graph into the second quadrant, we need to move it to the left and up. Using the vertex as a guide, we need to move to the left about 4 units and up about 6 units. This means replacing x with (x+4) and adding 6 to the end of the equation. This gives the following equation and graph.
Suppose we want to produce a graph that is concave down and shares the same vertex as our original graph. If we multiply our equation by -1, then we have , in effect, changed the sign of all of our y-values. Changing the sign of our y-values results in a graph that has been reflected about the x-axis, as seen below.
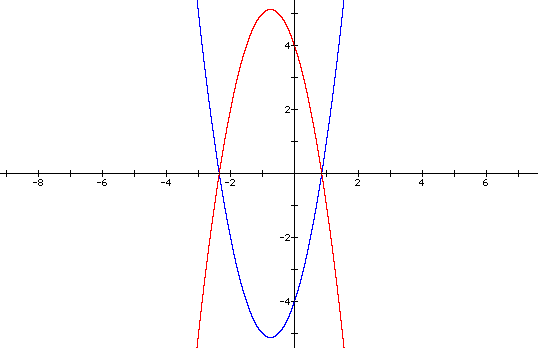
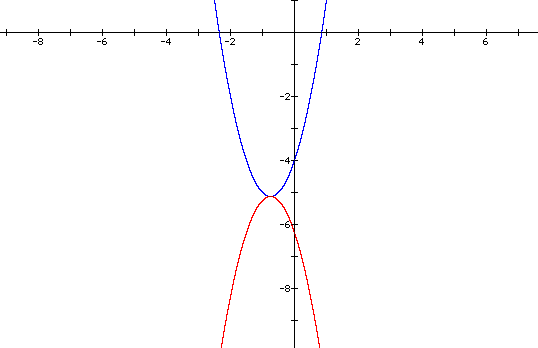
Now we have to shift the graph down by subtracting an appropriate number from our new equation. We need to figure out the y-values of each vertex and subtract their difference. The vertices represent the maximum or minimum value for each graph. By remembering some basic calculus, we come up with the answers. For our original equation, the y-value of the vertex is -41/8. For our new equation, the y-value of the vertex is 41/8. The difference between these numbers is 41/4. This is the number we want to subtract from our new equation. The equation and graph follow.
We have seen various methods for altering the graph of a parabola. The principles, however, should apply to all equations. It is left up to the reader to explore other equations.