
A parametric curve is a pair of functions
where f and g are continuous and define ordered pairs (x,y). The resulting curve's shape will be determined by the values of t.
Following is an investigation of equations of the form:
for 0<t<2(pi)
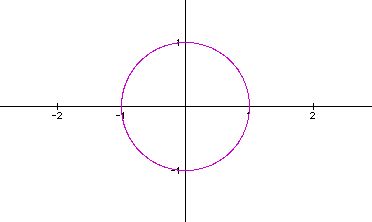
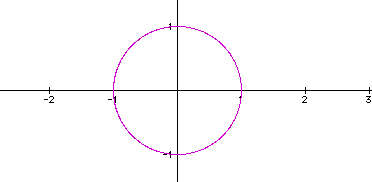
For the parametric equation
x= cos (t)
y = sin (t), we find the following graph, which is a circle with its center at the origin and a radius of 1:
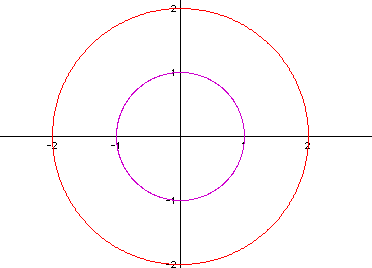
If we add x=2 cos (t) and y=2 sin (t) to the graph above, we generate the following illustration:
When we assign the value a so that a<b, we can create this graph of:
x= cos (t) 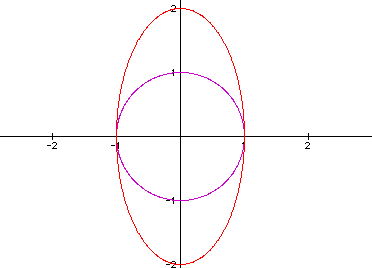
y = 2 sin (t)
And see that the greater b value creates an ellipse:
Similarly, we can see the shift created when
a>b: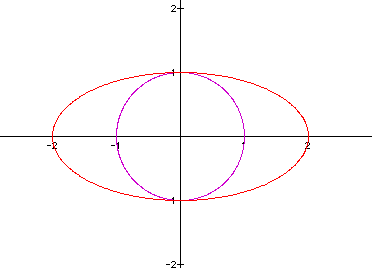
x= 2 cos (t)
y = sin (t)
The ellipse that is created now stretches horizontally instead of vertically. This change allows us to see the way the cosine function influences the equation in comparison to the change above, when the sine function was assigned a greater coefficient.
If we change the equations to the form:
x= a cos (t) + h sin (t)
y = b sin (t) + h cos (t) 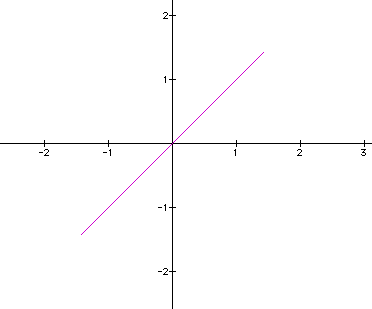
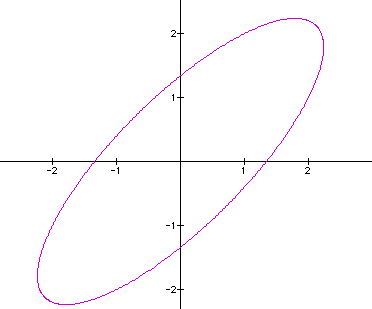
And assign h = 1 and b=1,c=1 initially, we see this graph:
If we change the values so that h=2 we can see a real difference:
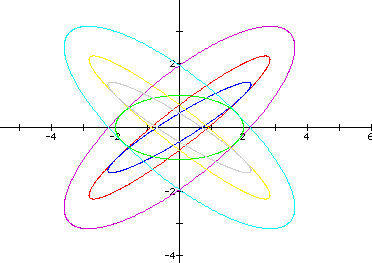
And for h=3 we see the same shape elongated. Below is a graph of the equation with h varying from -3 to 3:
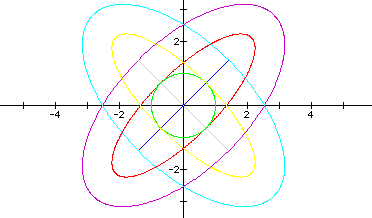
And below is a graph with the same varied values for h, with a and b = 2.
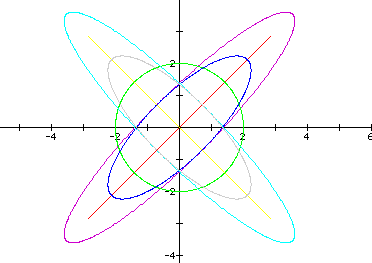
From these illustrations we can get a general idea of the influence a,b, and h have on the graph: h 'points' the ellipse and influences its length where a and b widen or narrow its shape. If we select a>b, we see the following:
The parametric equations of this form
x= a cos (t) + h sin (t)
y= b sin (t) + h cos (t)
describe the location of the vertex (x,y) of a triangle with altitude h while the two other vertices are moved, one along the x-axis and one along the y-axis.
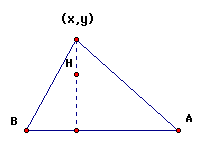 This illustration
enables us to visualize the changes: when A,B move along the x-
and y-axes, there is a third vertex determined by the altitude
H and given by the location (x,y). This location (x,y) is ultimately
the outcome of the parametric function.
This illustration
enables us to visualize the changes: when A,B move along the x-
and y-axes, there is a third vertex determined by the altitude
H and given by the location (x,y). This location (x,y) is ultimately
the outcome of the parametric function.
In the first representation of these graphs, we saw the line generated with H=1. With H greater than or less than one, the distance increases as the absolute value of H-1 increases. Since the altitude is a measure of distance, it cannot be negative. What can we conclude about the graph generated when h=0?
That withou the h-term, we are calculating (x,y) locations that create a circle when t ranges from 0 to 2pi, and these locations do not indicate the vertex of a triangle.