
This page examines the graphs of equations in the form x^2+xy=y^2=9
This is a graph of the function x^2+y^2=9

It is a circle with radius 3 and its center at the origin.
If we change the function to x^2+y^2=10, or x^2+y^2=12, the shape of the graph stays the same, but expands, as the radii are larger:

Even if we double or triple those values, the
function still creates a circle. Shown here are the graphs of
: x^2+y^2=9, x^2+y^2=20, and x^2+y^2=36 : 
If we add a term, xy, to the function so that
it becomes x^2+xy+y^2=9 the graph takes
on a new shape.
The graph of x^2+xy+y^2=9 is an ellipse with its center also
at the origin.
 If we set the function
equal to a larger value, as we do here, does the function retain
its shape? Below we add x^2+xy+y^2=20 to the graph:

If we change the coeffiecient on the xy term, does the shape stay the same and expand, does it expand in a different direction, or does the shape change entirely?
Let's compare x^2+xy+y^2=9 and x^2+1.5xy+y^2=9 :

The larger coefficient on xy lenghtened the
ellipse.
What can we expect if we increase the value of the coefficient
even further? The graph of x^2+xy+y^2=9 and x^2+3xy+y^2=9:

We can see that increasing the coefficient on xy to 3 has changed the shape of the graph from an ellipse to what appears to be a pair of asymptotic lines. This begs the question: at which value on the coefficient does the graph change from an ellipse to lines?
Let's try graphing the original function with the coefficient on xy increasing in smaller increments. Below is a graph of the functions:
x^2+xy+y^2=9
x^2+1.1xy+y^2=9
x^2+1.5xy+y^2=9
x^2+1.8xy+y^2=9


All of these values still generate an ellipse.
Let's try again, with larger values:
x^2+xy+y^2=9
x^2+1.9xy+y^2=9
x^2+2.1xy+y^2=9
x^2+2.3xy+y^2=9
The ellipse created by the coefficient 1.9 is large enough that it was necessary to change the scale on the graph to view the entire ellipse. Once we reach 2.1, the ellipse has changed into lines.
Let's examine the equations and their roots for the values 1.9 and 2.1 to see where and how the "jump" in the graph occurs.
If we look at a graph that includes the graphs of the equations:
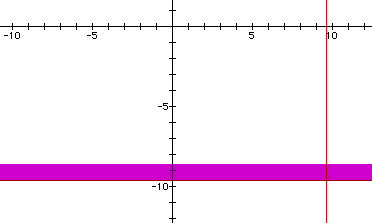
(9.6)^2+(1.9)(9.6)y+y^2=9, x=9.6, y=-9.6

We see from this graph that the purple area intersects with the lines representing x,y=9.6,-9.6 (the value 9.6 was selected because it is the value at the 'end' of the ellipse). This shows us that when x=9.6, the ellipse contains the point (9.6,-9.6).
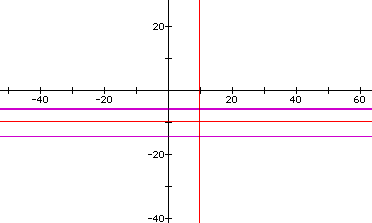
When the coefficient on xy is 2.1 the graph shows us that there are two purple lines that intersect with x=9.6. Where there was only one solution previously, there are now two.

For much larger values of x, say, 20, we can see the difference between the coefficients 1.2 and 2 on the xy term.
(20)^2+y^2+(1.2)(20)y=9 : For this equation, there is no graph because the value of y is undefined.
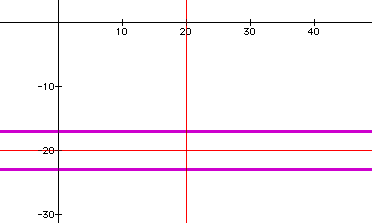
(20)^2+y^2+(2)(20)y=9 For this equation, the graph appears below and we see again that there are two equation lines (in purple) intersecting the x=20 line below.

With these representations, it is easy to visualize the differences created by the changed coefficient and their resulting influence on the definition of the graph
We can also see below the shape the graph takes for larger values of coefficients on xy, and notice the asymptote created by x=0:
xy coefficient = 12, 15, 18, 20:
 xy coefficient = 20,
30, 100, 1000
For one final look at the graph, below is a picture of the equation for positive and negative, larger and smaller values on the xy-coefficient. Quite a pretty picture!
