

Graph the equations of  on
the same axes is below.
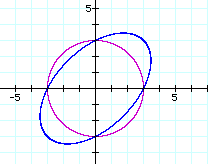
It is clear that the graph of the equation
of ![]() is circle. The graph of adding
the term of -xy is ellipse.
is circle. The graph of adding
the term of -xy is ellipse.
Let's try different coeffcients for the xy term.
Now, the coeffcients for the xy term are -1,-2,-3,-4,-5 is below.
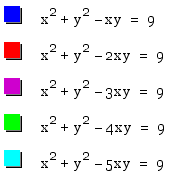
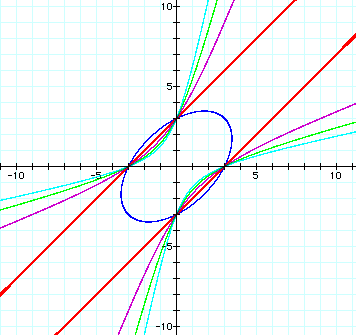
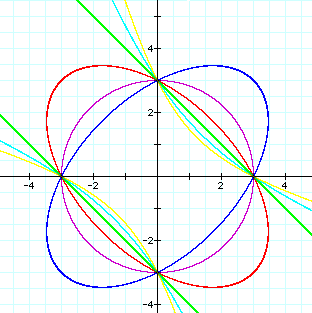
Then, there appear the ellipse and two lines and hyperbolas. We could say as following:
Temporarily the coeffcints of the xy term is n. As 0 > n > -2 , the graph is ellipse. As n=-2 , the graph is two lines. As n<-2 ,the graph is hyperbola.
More observe when 0>n>-2 as following:
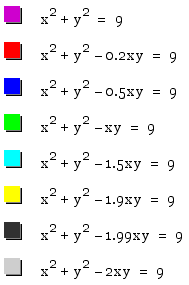
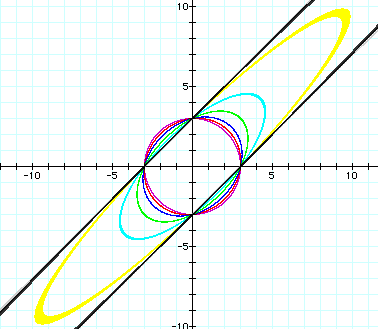
Cange the ranges to look the boundaries as following:
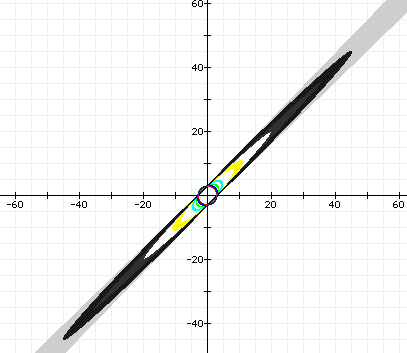
Next, the coeffcients for the xy term are 1,2,3,4.
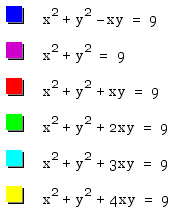
As 0<n<2, the graph is the ellipse. As n=2, the graph is the two lines. As n>2, the graph is hyperbora.
There are the four common points, (0,3),(0,-3),(3,0),(-3,0) ,on these graphs.
1. The four common points. Here
2. The graph of the equation of ![]() .
Here
.
Here