
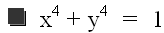
Let's examine the relationship of x and y in the following equation:
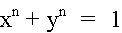
As the graph shows, as x increases y decreases and vice-versa. The graph is a bijective function. Knowing this, one can always calculate x when given y, or y when given x.
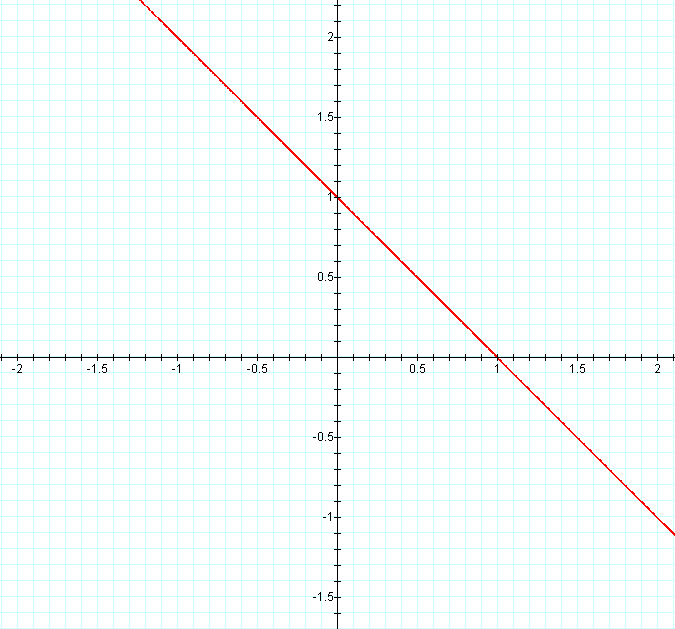
Examining the case where n = 2, we see that graph is that of the unit circle whose center is the origin.
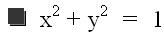
Thus, our values of x and y are limited to falling the interval [-1, 1] along both axises. Let's examine now the case where n = 3, as illustrated by the following graph.
We immediately see a connection between our first two graphs and this one. Our first graph was a line, and our second was a circle, which is a line that curves around on itself. This graph has a "corner" of a circle, and a curve which approximates a line on either side of the "corner." Although it is not shown in the graph, it can be easily seen that y = -x is an asymptote for the ends of the curve. What causes this behavior? The fact that our exponent is odd accounts for the fact that when the graph is outside of the "square" created by the [-1, 1] interval along both axises that whenever x is positive, then y is negative and vice-versa just as was the case in our linear function outside of the "square." The "magic of the square" is that in the interval [-1, 1] our values of x and y get smaller when raised to an odd power (with the exception of 0, of course). In Quadrants II and IV this only has a small effect on the curve, but in Quadrant I, it has very noticeable effect. It takes two values both of which are between 0 and 1 to add together to equal one, so we get a curve in Quadrant I.
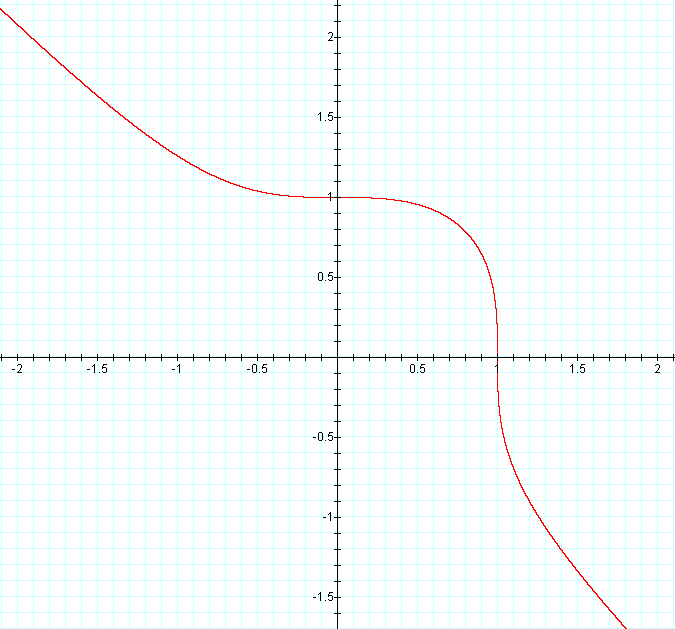
What happens to our graph when n = 4? This time the power is even. This means that all values of x and y when raised result in positive numbers. Thus, we get the same situation as was found in Quadrant I of the previous graph. This time the curve from Quadrant I is mirrored in every quadrant, as illustrated below.
Let's increase our n to 5. What do we notice this time? Three things are worth observing:
1) The graph is similiar to the graph when n = 3.
2) The graph outside of the "square" more closely approaches the graph of x + y = 0, or y = -x.
3) The graph inside of the "square" has a sharper curve to it.

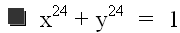
Taking the above graphs and our intution behind them, what can we extrapolate about higher even and odd values of n (our exponent)? We have seen that when n = 2, the graph was a circle. When n = 4, the graph was stretched out but still remained in the "square." So will higher even powers eventually gives us the "square" itself? The following graph gives a clue. Here we set n = 24.
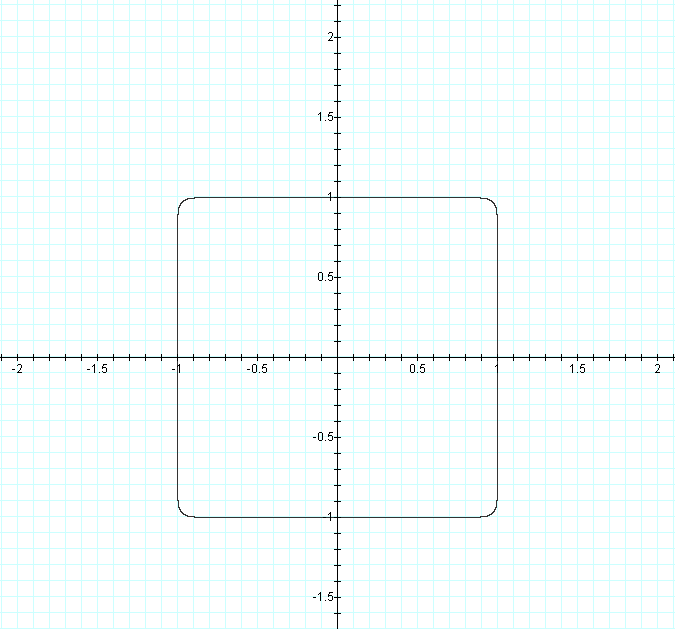
Can we use our intution to figure out why the graph continues to approach the "square" as we use larger even exponents? The answer lies in the fact that the limit of 1/x as x approaches infinity is 0. Thus, as x approaches 0, y must approach 1, and vice-versa. This results in the "square." If one was to graph large even values of n, the graph would look more and more like a perfect square.
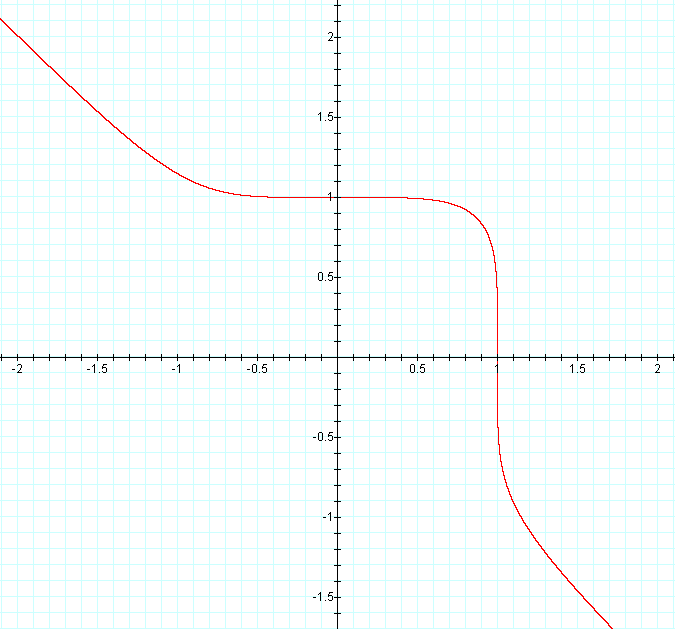
Taking n to be 25, we get the following graph:
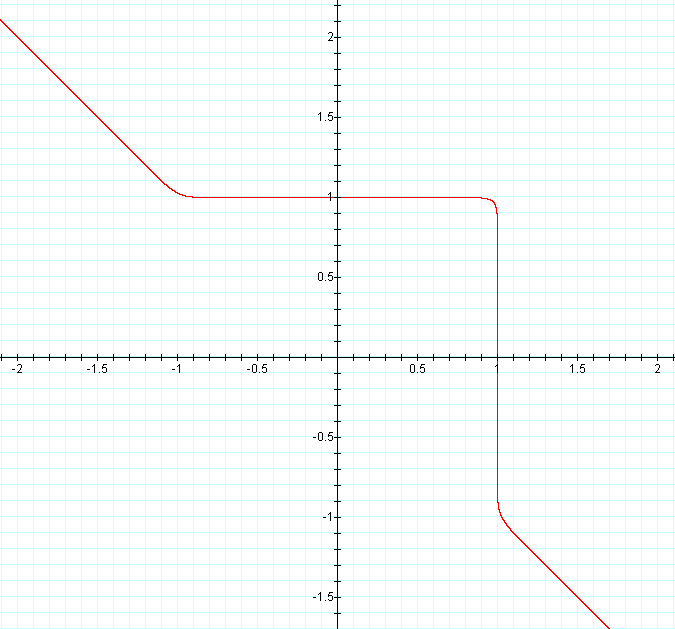
Here we notice that outside of the "square" the graph more closely approximates the graph of y = -x. Inside the "square," we get the top and right sides of the previous graph. Again, if one graphed large odd values of n, the graph would "line up" with the graph of y = -x outside of the "square," a horizontal line at y = 1 for x in (-1, 1) and a vertical line at x = 1 for y in (-1, 1).
| Return to main page. |