
Let's examine the relationship of ratios in the Fibonacci Sequence. The Fibonacci Sequence is obtained from the following function over the natural numbers:
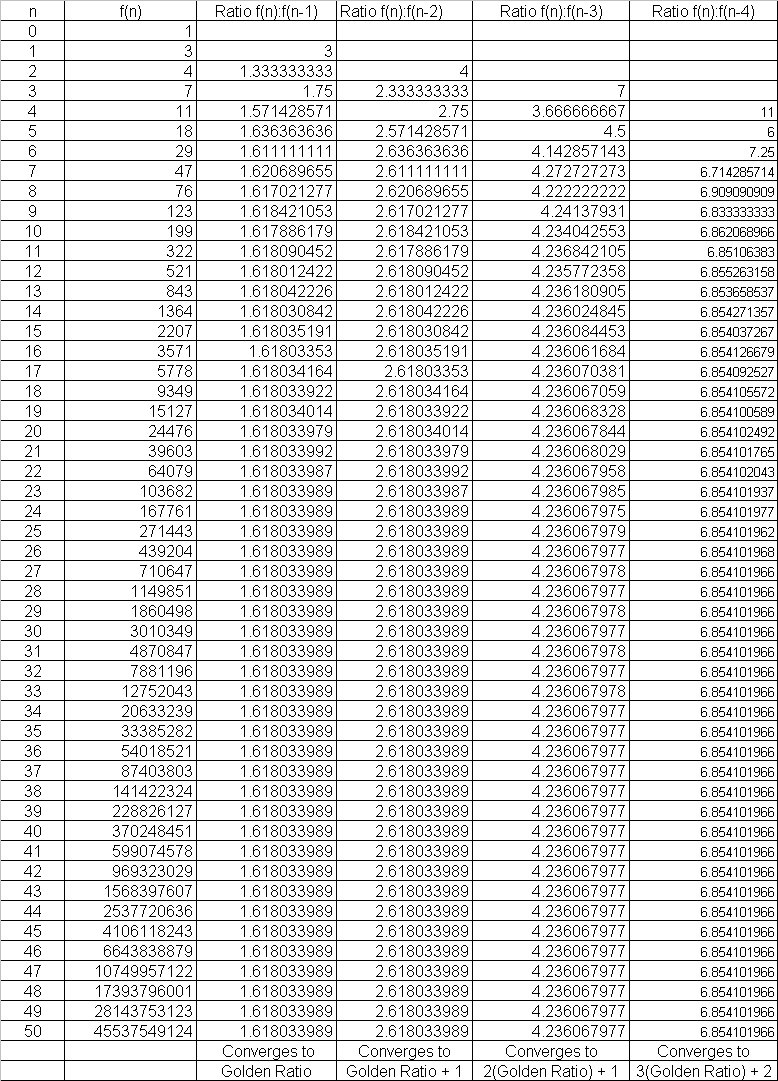
In the following table, we have n in the first column and f(n) in the second column. In the third through sixth columns we have the ratios of varying terms in the sequence. For instance,the third column is the ratio between adjacent terms; while the sixth column is the ratio between every term and the fourth term from it. Examine the table:
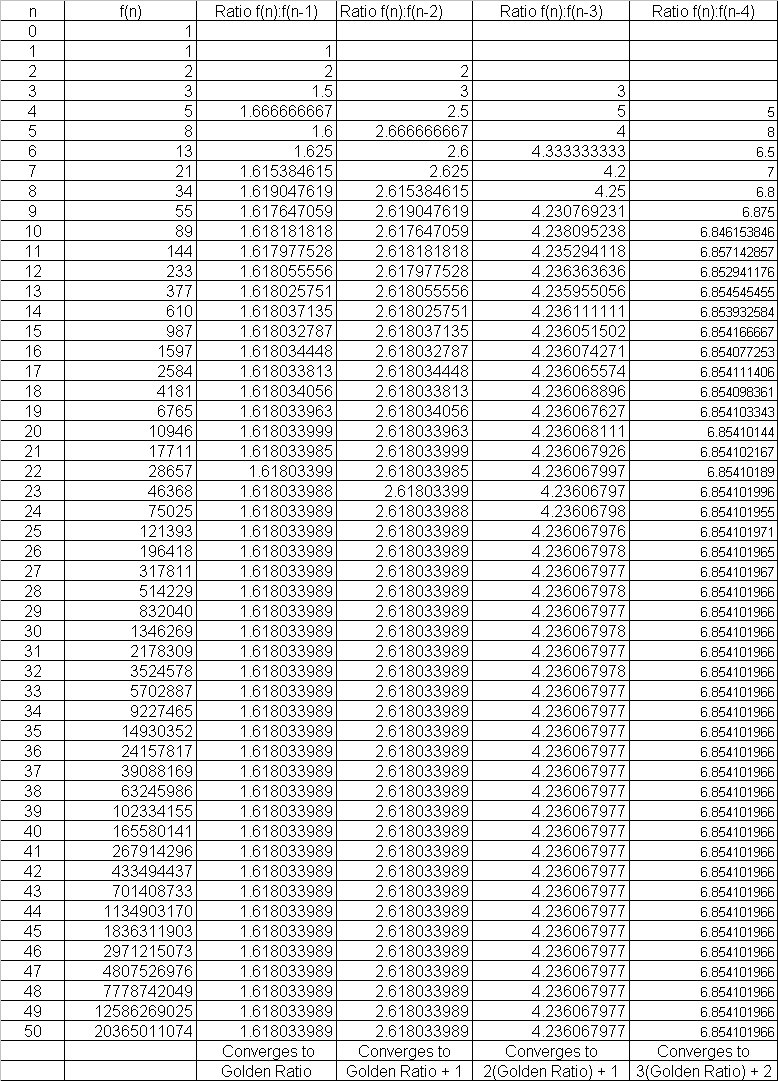
If we look at the bottom of each ratio column, we can see where the ratios converge. For the third column, the ratio converges to the Golden Ratio. The fourth column converges to the Golden Ratio plus 1. The fifth column converges to twice the Golden Ratio plus 1. The sixth column converges to three times the Golden Ratio plus 2. This suggest the pattern that the convergence of each ratio of terms increasingly further apart is the sum of the convergences of the two previous ratios... mimicking the Fibonacci Sequence.
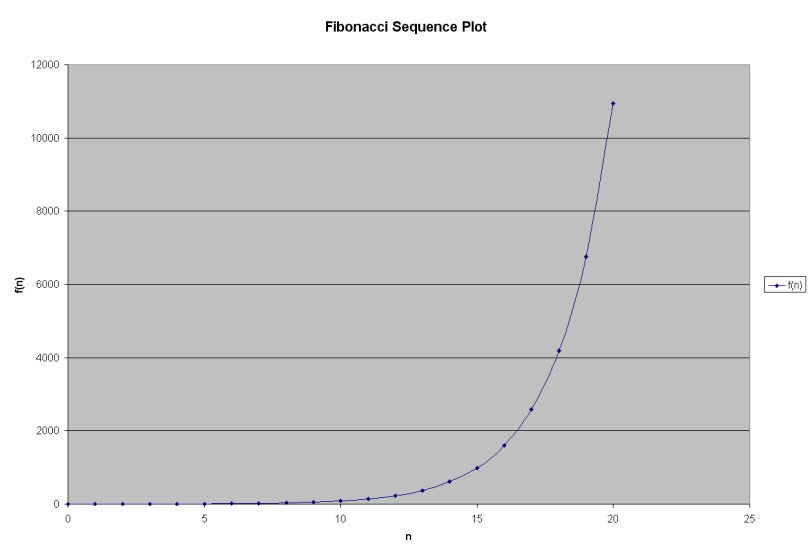
We can also look at a plotting of the Fibonacci Sequence. Due to the exponential growth of the function, our plotting is for n on the interval [0, 20]. Obviously, since the function is defined over the natural numbers, there is no " line " in the actual plotting. The line has been added to illustrate the exponential growth pattern.
Let's examine the relationship of ratios in the Lucas Sequence. The Lucas Sequence is obtained from the following function over the natural numbers:
The following table is similar to the table for the Fibonacci Sequence is for the Lucas Sequence. Examine the table:
Again at the bottom of each ratio column is the convergence value. Notice they are the same as for the Fibonacci Sequence.
| Return to main page. |