
Some
Different Ways to Examine

by
James W. Wilson and Janet
Kaplan
University of Georgia
___________________________________________________________________________________________________________
The goal of this investigation
is to explore the relationship between coefficients of the terms in quadratic
equations and the roots of these equations. By thoroughly examining the ideas
presented, it is the hope that students will develop a deeper understanding of
quadratic equations and their solutions.
_____________________________________________________________________________________________________________
It has now become a rather standard
exercise, with available technology, to construct graphs to consider the equation
ax2 + bx + c = 0
and to overlay several graphs of
![]()
for different values of a, b, or c, holding
the other two constant. From these
graphs students can discuss how the patterns for the roots of
![]()
change with the coefficients of the terms.
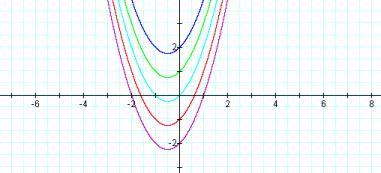
For example, if we set
![]()
for b = -3, -2, -1, 0, 1, 2, 3, and overlay
the graphs, the following picture is obtained.
We can discuss the "movement" of a
parabola as b is changed. The parabola always passes through the same point on
the y-axis ( the point (0,1) with this equation). For b < -2 the parabola
will intersect the x-axis in two points with positive x values (i.e. the
original equation will have two real roots, both positive). For b = -2, the
parabola is tangent to the x-axis and so the original equation has one real and
positive root at the point of tangency. For -2 < b < 2, the parabola does
not intersect the x-axis -- the original equation has no real roots. Similarly
for b = 2 the parabola is tangent to the x-axis (one real negative root) and
for b > 2, the parabola intersects the x-axis twice to show two negative
real roots for each b.
So the value of b, the coefficient to the x
term, determines the parabola’s location along the x axis, as well as the
number and value of the roots of the equation.
____________________________________________________________________________________________________________
Consider the locus of the vertices of the
set of parabolas graphed from
![]() .
.
Click
here to see how the parabola y
= (-x)2 + 1 is formed from the locus of the vertices. Is there a
general statement we can make about the relationship between y = x2
+ bx + 1 and y = (-x)2 + 1 ?
_____________________________________________________________________________________________________________
Now let’s look at what happens if we vary
the constant, c.
X2 + X + 1 x2 + x + 0 x2 +x - 1 x2 +x – 2 x2 + x + 2
Varying the constant term moves the parabola up and down the y axis. In doing so, it also plays a role in
the determination of the number of real roots. When c is negative, as in x2 + x -1, the graph has two
real roots (one positive and one negative). However, when c is positive, there
are no real roots.
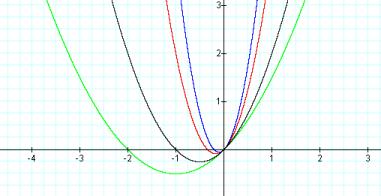
And if we vary a, the coefficient to the x2
term, we’ll see that the value of a determines the width of the parabola, and
consequently the value of the roots. While always having two real roots, notice
how their values change.
X2 + x + 0 3x2 + x + 0 5x2
+ x + 0 0.5x2
+ x + 0
_________________________________________________________________________________________________________
Graphs in the xb
plane.
As the investigation
continues, we explore quadratic equations from a whole new perspective.
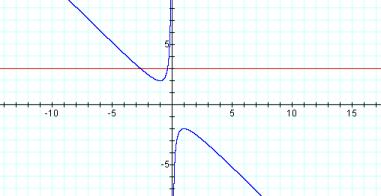
Consider the quadratic equation x2 + bx + 1 = 0. This is its graph in the XB plane.
But
how do we come up with this graph?
Why is it shaped like a rational function? It certainly doesn’t look like a quadratic equation. How can we make sense of it?
Isolating
the b value gives it to us. If
ordinarily we find y as a function of x, in the xb plane we find b as a
function of x. Solve our original
quadratic equation for b:
Start Y = 0
0
= x2 + bx + 1
bx
= -x2 -1
b
= -x2 - 1/x
b = -x – (1/x)
And now we call b the name
y, just so that we are operating on familiar terms again. If we graph y =
-x – (1/x) we do, in fact, get the graph pictured
above. In the familiar Cartesian
plane we graph a function by isolating and solving for y. It makes sense that
we isolate and solve for b in the xb plane.
____________________________________________________________________________________________________________
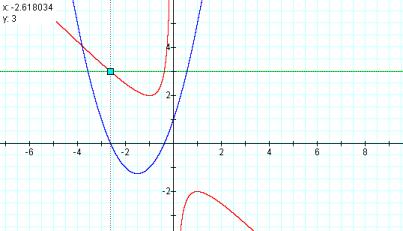
If we overlay the line (for
instance, b=3) on the graph above, the intersection points with the graph in
the xb plane (if they exist) correspond to the roots of the original equation
(x2 + bx + 1) for that value of b.
This
can be understood in the following way:
The roots of the original quadratic equation when b=3 (x2 +
3x + 1), are -.382 and -2.618.
Taking the function in the xb plane, (y = -x – (1/x)), replacing the x
with the root values, and setting it equal to our value of b, we have
b
= - x – (1/x) and
b = - x – (1/x)
3
= - (-.382) – (1/-.382) 3
= - (-2.618) – (1/-2.618)
3
= .382 + 1/.382 3
= 2.618 + 1/2.618
3
= .382 + 2.618 3
= 2.618 + .382
3
= 3 3
= 3
which is, of course,
true. So the line representing the
b value in the xy plane becomes the x axis in the xb plane. Just as the quadratic function in the
xy plane crosses the x axis at the roots -.382 and -2.618, so, too, does the
function in the xb plane cross the horizontal axis (b) at the same root values
of -.382 and -2.618.
X2
+ 3x + 1 -X – (1/x) Y = 3
____________________________________________________________________________________________________________
For each value of b we select, we get a
horizontal line. It is clear on a single graph that we get two negative real
roots of the original equation when b > 2, one negative real root when b =
2, no real roots for -2 < b < 2, one positive real root when b = -2, and
two positive real roots when b < -2.
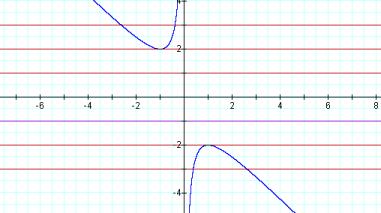
This
is precisely what we found when examining the original quadratic equation, x2
+ bx + 1.
__________________________________________________________________________________________________________
Graphs in the xc
plane
In the following example the equation
![]()
is considered. If the equation is graphed in
the xy plane, it is easy to see that the curve will be a parabola. For each
value of c considered, its graph will be a line crossing the parabola in 0, 1,
or 2 points -- the intersections being at the roots of the original equation
for that value of c.
x2 + 5x + 1
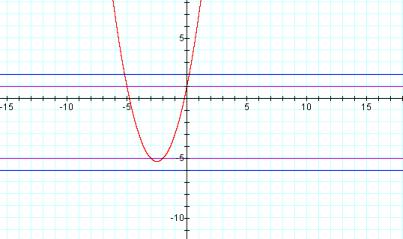
At c = 1, for instance, the
equation x2 +5x + 1 has two negative roots – approximately -0.2 and
-4.8. At c = -6.25, the equation
has just one real root. At values of c less than -6.25, there are no real
roots.
_____________________________________________________________________________________________________________
The factors involved in the
study of quadratic equations are often taught separately, with few connections
made to their interrelatedness. By
using these examples to explore quadratic relationships more fully, it is the
hope that students will develop a deeper understanding of them.