
Weaving
Graphs from Parametric Equations
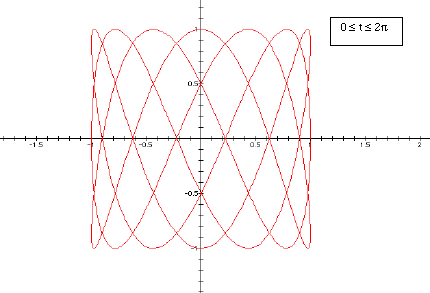
Consider the following parametric equations:
x
= cos (3t)
y = sin (7t) where t ranges from 0 to 2 pi .
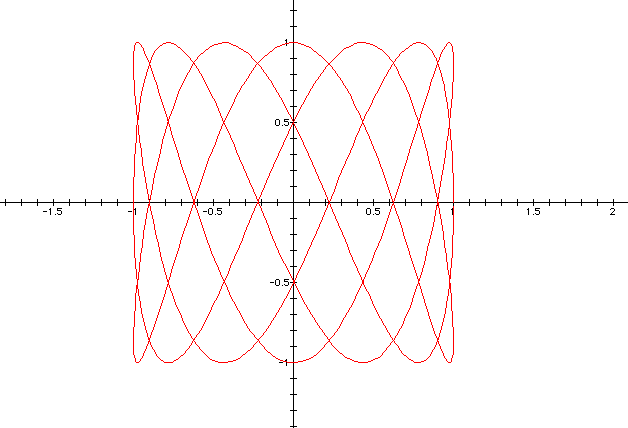
We see that the graph weaves around the
origin and the pattern has an overall square shape to it. We can take different
ranges of t to show more clearly how this weave develops.
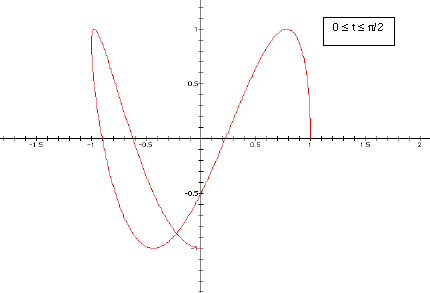
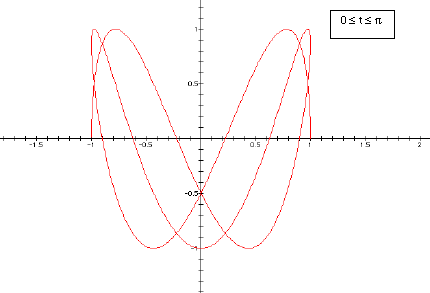
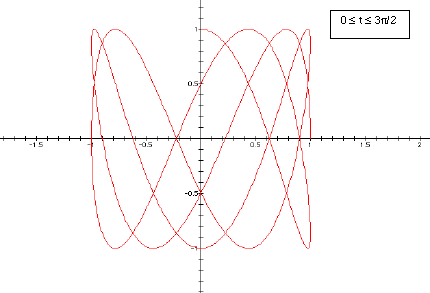
So we are interested in looking at the graphs
of the parametric equations:
x
= cos (a*t)
y
= sin (b*t) where t ranges from 0 to 2 pi.
In particular we are interested in the
positive integer values of a and b that produce a weave or mesh-like graph.
This generally occurs when a and b are both
greater than 1, and neither a nor b is a multiple of the other.
Let's first consider the case where a > b. We will fix a equal to 7 and show the graphs where b is equal to 3, 4, 5, and 6.
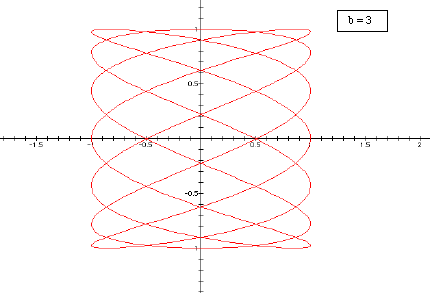
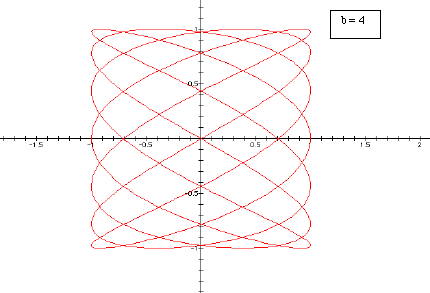
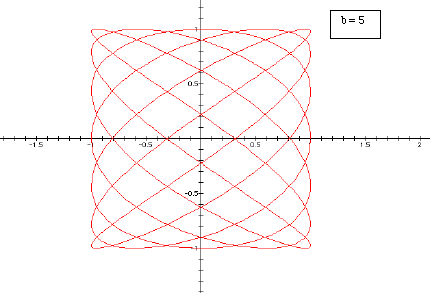
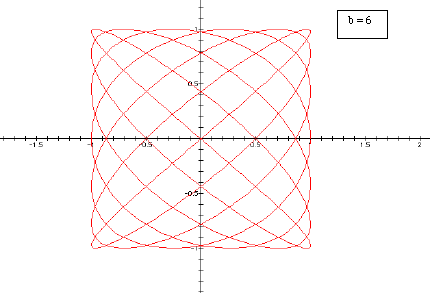
So we can see that as b increases the graph
becomes a more tightly would weave.
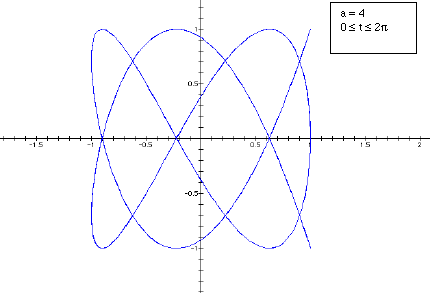
Now we will look at the case where b > a. We will fix b constant at 7 and let a take on the values 3, 4, 5, 6.
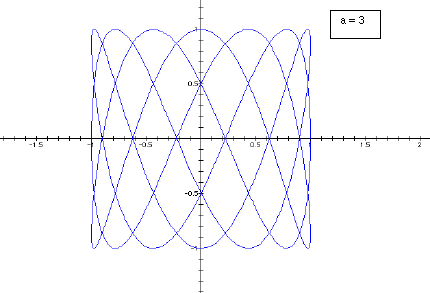
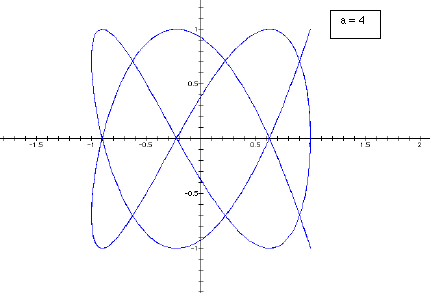
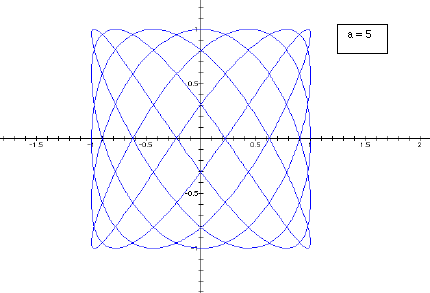
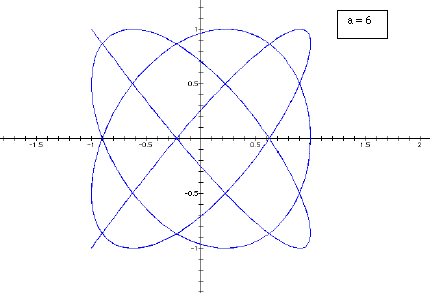
We see a slightly different phenomenon here.
The odd values of a behave much the same way as in the first case. As a (odd
values) increases the graph becomes a more tightly wound weave. But when a is
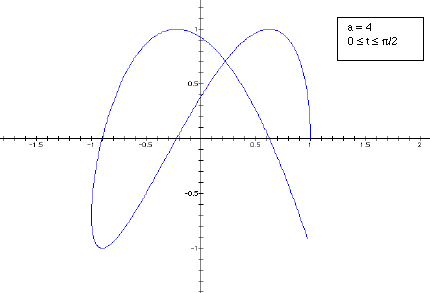
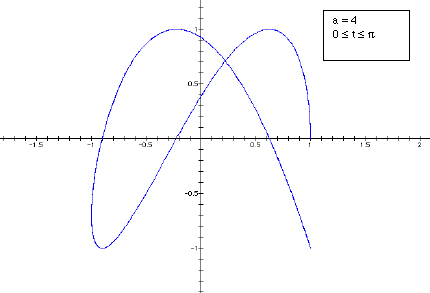
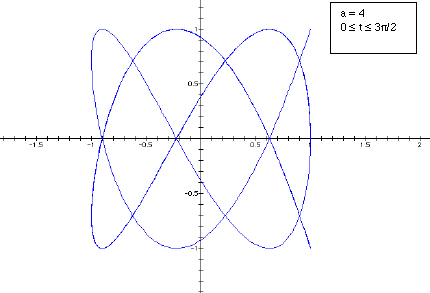
even the weave does not appear closed. In fact, the graph traces the half of
the curve to a point and then retraces its steps back to the starting position.
It then traces the second half of the graph to a second point before retracing
its steps again back to the starting point. This is demonstrated below.
Click here for
a Graphing Calculator 3.1 file to try other values for a and b.