Assignment 2
Writeup: Prob #10
Key Points:
To explore details for this and all GSP File:
Problem Statement
10. Graph
![]()
Now, on the same axes, graph
![]()
Describe the new graph. Try different coefficients for the xy term.
Solution
|
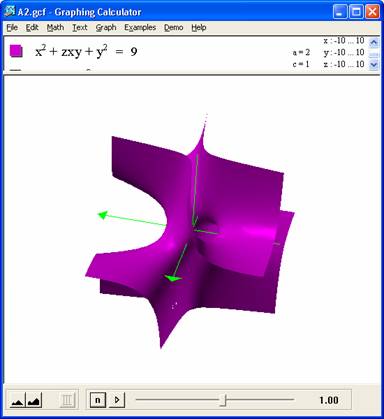
To give overview perspective, graph: This looks cool, as per graph. It appears that for z> 5+ , we have a hyperbola. As z gets closer to 0 various things happen and then in the –z dimension we have a mirror of +z but in the opposite x –y quadrants. Must explore 4<z<-4 in more detail |
|
What kinds of graphs do you generate? What coefficients mark the boundaries between the different types of graphs?
How do we know these are the boundaries? Describe what happens to the graph when the coefficient of the xy term is close to the boundaries.
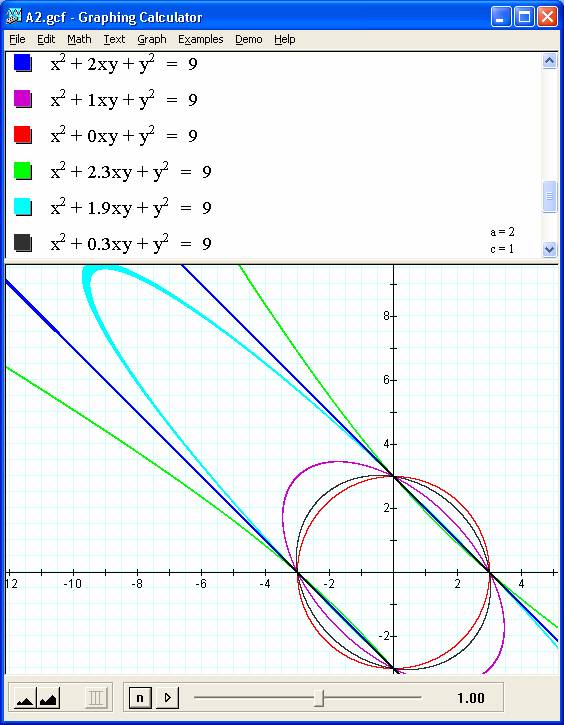
Changes from circle to ellipse as coefficient (a) is non zero number + or -.
Perhaps most interesting transition is as ellipse transitions
into a hyperbola as (a) approaches and exceeds 2. At a=2 we have a pair of straight lines. To see why, we can see that for coeff a = +/- 2 the equation can be rewritten in form (x+ay)^2 = 9. Take roots of this and we can then see graphs
of the lines ![]() and
and ![]() are equivalent and overlap the graph.
are equivalent and overlap the graph.
Notes on Other Problems
1. Construct graphs for the parabola
![]()
for different values of a, b, and c. (a, b, c can be any rational numbers).
Taking simplest y= ax^2 + 0x + 0, we get parabola with vertex at 0,0. lim as a-> 0 is a flat line and as a-> ∞ is a pair of vertical lines up or down according to sign.
B in interesting, It moves the vertex in a parabolic path pointing downward (seems) with a focus at the origin. Positive b moves vertex in negative x direction and negative in positive x.
If a is 0 then simply line with slope b. c simply moves up and down, of course
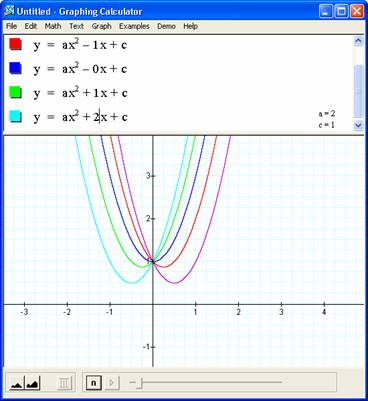
2. Fix two of the values for a, b, and c. Make at least 5
graphs on the same axes as you vary the third value. For example,
![]()
![]()
3. Adjust the ranges on the axes in Problem 2 to produce graphs that can be read, interpreted, and used for demonstration.
4. Interpret your graphs. What happens to
![]()
(i.e., the case where b=1 and c=2) as a is varied? Is there a common point to all graphs? What is it? What is the significance of the graph where a = 0? Do similar interpretations for other sets of graphs. How does the shape change? How does the position change?
See above.
5. For demonstration, is it better to graph 5 graphs at once or produce them in
sequence adding one at a time? What are the pedagogical implications of this
observation?
See above. Seems best to do one at a time because it allows conjecture by class for where graph will move, then validation. Could have all graphs pre typed in and just turn them on one at a time, but as long as changes are quick, just editing them during. Also confusing to see which graph is which above.
6. Graph
![]()
i. Overlay a new graph replacing each x by (x - 4).
Translates +4 in the x.
ii. Change the equation to move the graph into the second quadrant.
Y=x^2+4x+4 does it
iii. Change the equation to produce a graph concave down that shares the same vertex.
Just put – in front
7. Try several graphs of
![]()
on the same axes. (i.e., use different values of a)
Looks like flapping wings when animated. Lim as a->0 is a flat line.
8. Produce several ( 5 to 10) graphs of
![]()
on the same axes using different values for d. Does varying d change the shape of the graph? the position?
Just moves graph along x axis.
9. Graph
![]()
Now, on the same axes graph
![]()
Describe the new graph. Change the range on the y-axis from -25 to 25 and redraw. Now interpret. What do you think will happen if we change the coefficients of the xy term?
Creates parabola tilted toward the
-y with same x y axis intercepts as the parabola (since xy
will be 0 along any axis). When seeing
on bigger axis we see it's really a hyperbola.
Systematically try different coefficients for the xy
term. Are they always the same types of curves?
If a = coefficient of xy, for -1 Creates hyperbola with same x y axis intercepts as the parabola. What about coefficients which are close to zero?
Hyperbola created with a<-.56, and a>3.5.
When a=0 is a simple parabola.
How does the sign of the coefficient change the graph?
x
10. Graph
![]()
Now, on the same axes, graph
![]()
Describe the new graph. Try different coeffcients for the xy term. What kinds of graphs do you generate? What coefficients mark the boundaries between the different types of graphs? How do we know these are the boundaries? Describe what happens to the graph when the coefficient of the xy term is close to the boundaries.
Changes from circle to ellipse when coefficient (a) is > or
< 2. For coeff
= +/- 2 the equation can be rewritten in form (x+ay)^2 = 9. Take roots
of this and we can then see graphs of the lines ![]() and
and ![]() are equivalent.
are equivalent.
Did your find this?
Or,what about this?
Or, try this one.