

Problem: Given a set of data formed by measuring the length of a guitar string from a fret to the bridge of the guitar plot a graph of points where the fret number is the x-coordinate and length is the y-coordinate. Write a function that produces this graph.
Investigations/Explorations:
I began by looking at my data in my excel file spreadsheet and making a xy scatter plot of the data I was given.
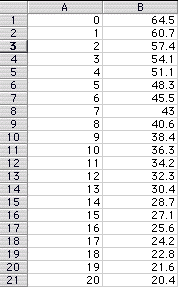
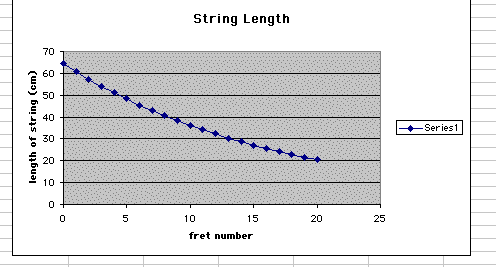
By looking at this graph I noticed that it looked like the graph of an exponential function. So, my next step in trying to solve this problem was to go to graphing calculator and investigate several exponential graphs.
Here is the graph:
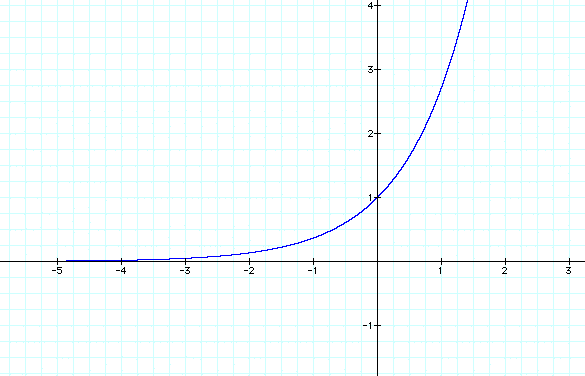
Notice that the slope of this graph appears to be in the opposite direction of the slope of my graph.
So, then I looked at the graph of the following equation:
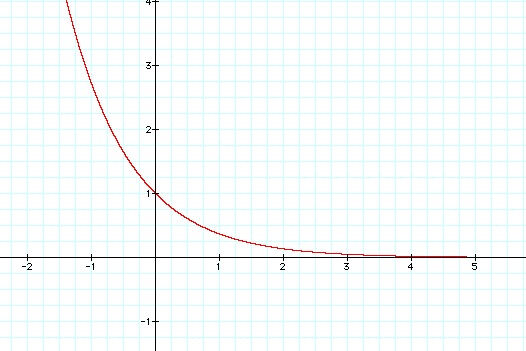
Notice that this graph goes in the same direction as the slope of my graph for my string data. So from this I determined that the equation must be of this form somehow. This makes sense because an exponental curve is a graph of something growing proportionally with time as well as with quantity. If I look at my data instead of growing with the number of frets on the guitar, the string length of my guitar is shrinking. Therefore it makes sense that the graph is:
By looking at the following graphs:
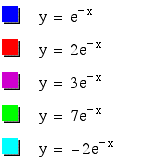
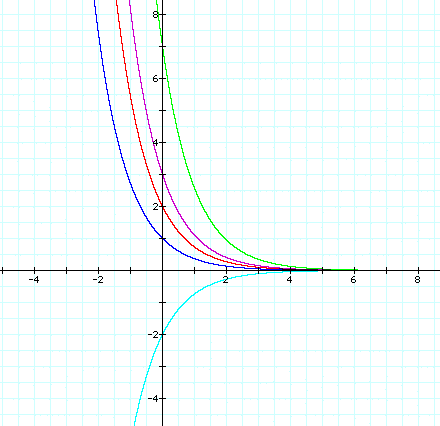
I observed the following:
I observed that for each of these equations the graph always crosses the x-axis at the number in front of:
I also know that when x is 0,
is one, so to find y-coordinate I must multiply that value times:
In this case when x=0, y = 64.5.
Therefore at this point I hypothesize that the equation of my graph must be of the form:
I simply now, must determine what a is.
If I look at several graphs in graphing calculator for different values of a, I will obtain the following:


Notice that as the absolute value of a gets larger the slope of the graph increases and that as the absolute value of a gets smaller the slope of the line becomes smaller. The slope of the graph that I have drawn appears to be pretty flat, so that indicates to me that the absolute value of my a value will be pretty small.
In order to determine a, I determined that it would be necessary to find the ratio between the lengths of my string for each fret. This ratio helps determines the rate at which the length of my string is shrinking.

In order to determine a more precise ratio I determined the arithmetic mean of these ratios.
Now how does this help me?
In this case the fret increases by one each time while the ratio between the length of the string stays close to 0.94406996. Since I am increasing by one fret with each string length I will take my increase of 1 and subtract the arithemetic mean of the ratio between the string lengths. This gives me the rate as a proportion of both the fret number and the string length.
This gives me 0.05593004.
This tells me that the rate at which the string length is shrinking with respect the increase in frets is:
So, in this case I hypothesize that the equation of the graph of my data will be:
Notice that since the slope of the graph given to me in excel is very small from the graphs that we investigated previously, it makes sense that the absolute value of my a, in this case is very small.
In order to test my hypothesis using my developed equation I put in several values of x, the number of frets in order to determine y, the length of my string.
I plugged in fret numbers 0 to 21 into my formula in excel and obtained the following values for y:

I then graphed this data, along with the data that was given to me in the excel document.
My graph looks as follows:

In order to determine the goodness of fit of my line I determined the variance between my data and the data given to me during the experiment.
The variance was:
0.37648267
I also determined the standard deviation which in this case is:
0.61356163
The goodnes of fit of my exponential curve is pretty good because my variance and standard deviation are close to zero.
Click HERE to view my excel spreadsheet with this data.
Author and Contact:
Jennifer Shea