Assignment 10: Parametric Equations
by
Melissa Silverman
Similar to the first few investigations,
graphing calculator will be used to explore various parametric
equations and their graphs. We begin with a simple parametric
equation and its graph.

 The graph is a circle centered at (0,0).
The radius of the circle is 1.
How can we alter the parametric
equation? Do these alterations change the graph? We can begin
by adding a coefficient in front of the cosine function.

 Putting a coefficient in front the
of cosine function changes the width of the graph. The figure
is still centered at (0,0). The size of the coefficient determines
the width of the enclosed shape. In this example, the coefficient
is 2 and the width of the shape is four units, 2 units on either
side of the origin.
From the above example, one can infer
that putting a coefficient in front of the sine function must
change the height of the figure, while the center remains at (0,0).

 The height of the figure is now 4 units,
2 on either side of the origin.
Combining coefficients results
in larger enclosed figures. When the coefficients are equal, the
shape is a circle whose radius is equal to the coefficient. Both
graphs are still centered at (0,0).


What if the sine and cosine functions
are squared? The result is a line segment whose endpoints are
the coefficients of the parametric equation. The graph is no longer
an enclosed figure. In this example, the coefficients are both
1, so the segment spans from (0,1) to (1,0).


Changing the coefficients change the
span of the line. The coefficient of the cosine function determines
the endpoint of the segment on the x-axis while the coefficient
of the sine function determines the endpoint of the segment on
the y-axis. For example, when the coefficients are 2 and -2 for
the cosine and sine function (respectively), the line segment
spans from (0,-2) to (2,0).


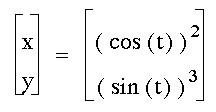
What about cubing the parametric equation?
What would the graph look like?

 The graph has a similar shape to a
diamond. The vertices of the diamond are all 1 unit away from
the origin because the coefficients are 1. Changing the coefficients
of the parametric equation will alter the placement of the vertices
of the diamond.


If the graph is raised to an even power
higher than 2, the graph is a curve, where the coefficients of
the sine and cosine function determine the y and x coordinates,
respectively.

 And the graphs continue in this pattern.
For all odd powers, the shape of the graph is a diamond. For all
even powers (greater than 2), the graph is a portion of a curve.
Combining even and odd powers results
in a "v" shaped curve, for all cases of even and odd
exponents. If cosine is raised to an odd power and sine to an
even power, then the graph is symmetric about the y-axis. If cosine
is raised to an even power and sine to an odd power, then the
graph is symmetric about the x-axis.


Like Investigation 1, explorations
such as these are important in understanding parametric equations
and their graphs. In this investigation, the primary focus were
the sine and cosine functions. By manipulating coefficients and
exponents, much was learned about how changing the parametric
equation affects its graph. This allows one to know what the graph
of a parametric equation will look like just by looking at its
form. And by looking at a graph, one can predict the graph's parametric
equation. This flexibility is important to mathematical understanding.
In the first investigation, much of the experimenting could have
been done with a graphing calculator or pencil and paper sketches
because parabolas are more simple to draw. Using computer technology
to investigate parametric equations allows one to do things that
could not easily be done on paper. This assignment is certainly
a good example of where technology allows one to do things not
easily done on paper.
Assignment
9 | Home Page | Assignment
11


