
Parametric Curves
By
Audrey V. Simmons
Let’s look at several graphs where x and y are
expressed in terms of parameter t.
We will be evaluating the changes that occur in the graphs when we vary the coefficients of a and b in the following parametric equations:
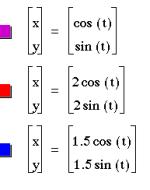
x = a cos (t)
y = b sin (t)
Let 0<
t < ![]() for all
the graphs investigated.
for all
the graphs investigated.
PART I
Let b = 1 and vary a.
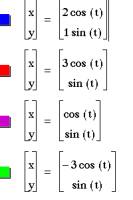
When a =1 and b=1 we have our unit circle. (![]() )
)
When a and b are different we have an ellipse. (![]() )
)
|
t |
Cos (t) |
Sin (t) |
|
0 |
1 |
0 |
|
|
|
|
|
|
|
|
|
|
|
|
|
|
0 |
1 |
|
|
0 |
1 |
Since the cosine of zero is one, our values for x will be a
factor of a.
When a = -3 the graph looks the same as when a = 3. The orientation or direction of the graphs is different.
PART II
This time we will let a=1 and vary b for all t such
that 0 < t <
![]() .
.
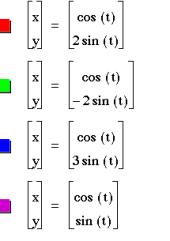
The purple graph is still our unit circle. However, this time our ellipse is elongated vertically instead of horizontally.
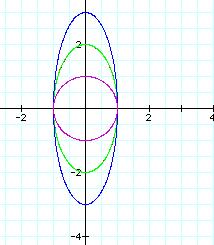
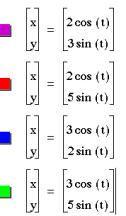
PART III
What happens when we vary both a and b?
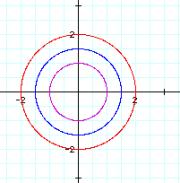
Since a=b, the graph is of a circle with radius equal to a and b. If a or b had been negative, the graph would still be a circle of radius equal to the absolute value of a or b.
When a and b are different values our graph is different than the circle. It is now the ellipse.
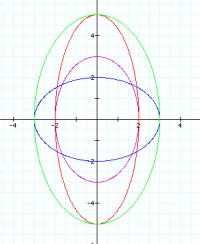
When a=2, -2 the ellipse crosses the x axis at (2,0) (-2,0). When
a=3, -3, the ellipse crosses the x axis at (3,0) (-3,0).
When b =2, -2 the graph crosses the y axis at (0,2) and (0,-2). When
b = 5, -5, the graph crosses the y axis at (0,5) and (0,-5).
Click HERE to see an example of changing graph for a parametric equation where t has a changing coefficient.