
Polar Equations
By
Audrey V.
Simmons
We will be examining polar equations in this investigation to see what effect changes in the coefficients have on the graphs. The polar equations will graph into some amazing shapes that you will enjoy.
Our polar equation will have the form r = a + b cos ![]() .
.
PART 1
Let’s examine the function when a=0 and k=1. Our new equation will be of the
form r = b cos ![]() .
.
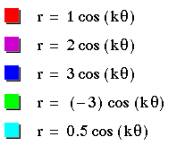
If b is positive the graph lies to the right of the y axis. If b is negative as in the case of b=-3, the graph is reflected to the left of the y axis.
When b=1 the diameter of the graph of the circle is 1. When b = 2 the diameter is 2. The diameter of the circle is the absolute value of b.
Notice that the circle is always tangent to the vertical axis at (0,0) and the center of the circle lies on the horizontal axis. Remember we are setting a=0 and k =1.
For an animation of the equation from -5<b<5 click here.
PART II
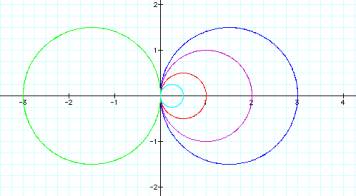
This time let’s set a = b and k =1. Our new equation is
r = a + b
cos![]() .
.
When a=b, we no longer have a circle. Instead we have a cardioid. The cardioid is symmetrical about the x axis. The diameter appears to be twice the absolute value of b.
PART III
By using different values for a and b we will transform our polar equation again. We will keep a=1 and vary b first. Our equation becomes
r = 1 + 2 cos ![]() .
.
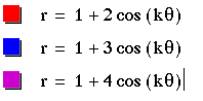
As b increases the size of the cardioid also increases. The inner loop increases at the same rate. If b was negative, our graph would be a reflection across the y axis. Click here for some examples.
What happened in the graph as the values for b approached zero?
Our graph approaches the equation r =1 which is a circle.
Even if we changed the values of a and b, our graph would be a cardioid as long as k =1. Click here to see.
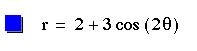
Only when b was negative did the graph reflect over the y axis. When the value of a was negative the graph
of r = -2 + 3 cos ![]() was the same as the
was the same as the
graph of r = 2 + 3 cos ![]() .
.
PART IV
When we vary a and b and we let k be an integer, the shape of our graph is called an “n-leaf rose.” Our starting equation is
r = a + b cos ![]() . This time we
will vary k.
. This time we
will vary k.
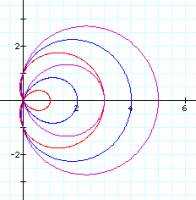
When a = b = 1 we have an “n-leaf rose”.
Since k=2, we have 2 petals.
![]()
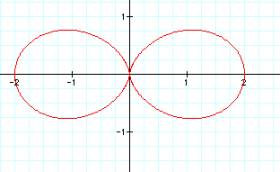
When k =3, we have 3 petals.
![]()
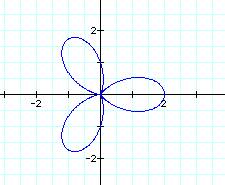
However, look what happens when we change the values for a and b.
![]()
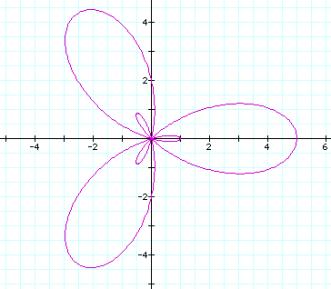
Have you noticed a relationship between the number of petals and
the value of k? As the value of k increases the number of petals increases respectively. Click here to see some more examples.
What effect did the –5 have on the graph? Did it change the actual size of the graph or just its orientation?
PART V
Even though we have not
exhausted all the possible relationships of the polar equation r= a +b cos ![]() ,
we are going to see what effect changing to the sine function has on some of
these equations.
,
we are going to see what effect changing to the sine function has on some of
these equations.
Let’s let a=0,
k=1 and vary b. Our new equation
is r = b sin ![]() .
.
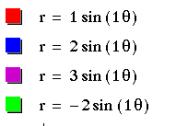
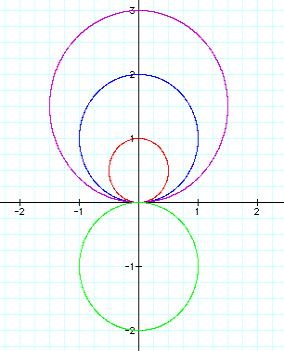
The similarity to the cosine function is evident in the fact that the absolute value for b is equal to the diameter of the circle. A negative value for b does not change the size of the circle. The center of the circle is is on the vertical axis as opposed to the horizontal axis with the cosine function. When b is negative the reflection occurs across the x axis.
PART VI
Set a=b and k=1
to determine the effects of coefficient changes on the sine function. Our equation is now r = a + b sin ![]() .
.
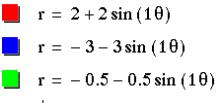
We again end up with the similar graph to the cosine function only the orientation is vertical instead of horizontal.
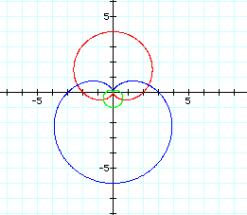
Set a=b=1 and vary k. The equation is r = 1
+1sin ![]() .
.
![]()
![]()
As you can see the shapes are the same, but the orientation is different.
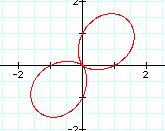
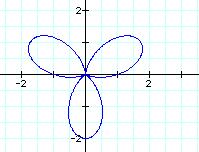
Our last examples vary a, b and keep k =4.
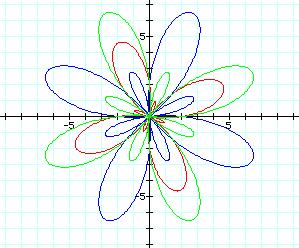
Our findings are still the same. The affects of a, b and k are the same on both of the trigonometric functions. The difference is in the orientation of the sine and the cosine function.