
GRAPHING PARABOLAS
By
Audrey V. Simmons
Parabolas are written in the
form y=ax2 +bx +c.
(Sometimes they are written in vertex form which is y= a(x-h)2
+h, but we are going to leave that for later.) We will vary the coefficients a, b, and c to see what affect
the changes have on the shape and location of the parabola.
Step 1: Let a=1, b=0 and
c=0. Our graph becomes y = x2 . This graph of
the parabola is called the parent graph.
All other graphs are variations of this one. Where is the vertex of the parabola?
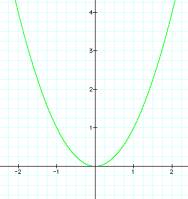
Vertex
(0,0)
Step 2: Vary the values for a, but let b=0 and c=0. We will keep the green graph (our parent
graph) so that we can use it for comparison purposes. What happens to the parabola as the value of a increases?
What happens when the value of a is a negative number?
Does the vertex stay in the same position? Try different values for a in graphing calculator.
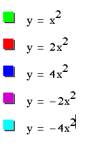
As you can see from the
graphs, when the value of a > 0 the
parabola opens up. When the value
of a<0, the parabola opens
down. Yes, the vertex remains at the point (0,0). As a increases, the parabola becomes thinner. The parabola
widens as a approaches 0. What graph would we have if a=0? (y= 0x2+bx +c)
By substituting zero for a we now have the equation, y=0x2+bx
+c. This simplifies to y= bx
+c. This is familiar to us as the
equation of a line.
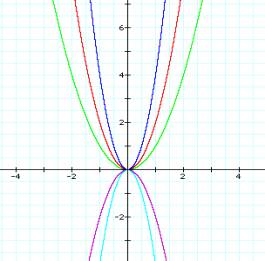
Step 3: y= ax2 +bx +c Let a=1, b=0 and vary c.
Use graphing calculator to
test values for c. See the
examples below after you have tried some on your own.
Examples: y = x2 V: (0,0) ; y =
x2 + 3 V:( 0, 3) ; y
= x2 +5 V: (0,5)
y = x2 + (-3) V: (0, -3); y = x2 –5 V:(0, -5)
The value of c causes the parabola to shift up or down. The shape of the parabola has not
changed. It has just moved up or
down according to the value of c.
Remember all this time a=1 and b=0. The y value of the vertex moves up or down c units.
When c is positive, the
parabola shifts up. When c is negative, the parabola shifts down.
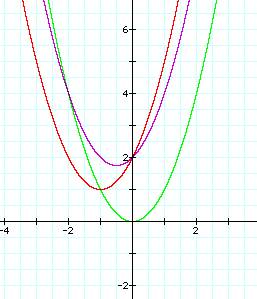
Step 4: y = ax2 +bx +c Let a=1, c=2, and vary b. y = x2 + bx +2
Look at the three graphs
below. Two graphs have shifted up
(c=2) from the position of the parent graph. However, they have not shifted up 2 units. What effect does b (the coefficient of the x term) have on the movement of the parabola? Try several graphs in graphing
calculator to see if you can determine any relationships.
y= x2
V: (0,0) y = x2
+1x + 2 V: ![]() y = x2
+ 2x +2 V: (-1, 1)
y = x2
+ 2x +2 V: (-1, 1)
Did you determine that even
though b was positive, the graph
moved to the left? Is there a
relationship between b and a? Do we
notice any relationship changes in the x value of the vertex?
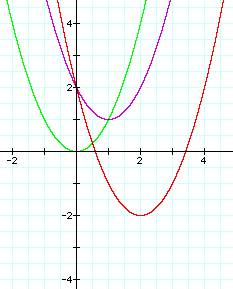
Below are two additional
graphs where b is negative.
y= x2 – 2x
+2 V: (2,-2)
y= x2 –4x +2 V: (1, 1)
If c is positive why is does the graph move down? The value of y is dependent on the
value of x. The value of the x coordinate is equal to ![]() . Look back at
the values of a and b and compare them to the x value of the vertex. Do you see the relationship that
exists? Once we know the value of x, we can put it in the quadratic equation to find the
value of y. It is important to pay attention to all
parts of the equation.
. Look back at
the values of a and b and compare them to the x value of the vertex. Do you see the relationship that
exists? Once we know the value of x, we can put it in the quadratic equation to find the
value of y. It is important to pay attention to all
parts of the equation.
Click HERE
to see a graph of a parabola for values of b between –5 and 5.
To summarize, the value of a
affects the width of the parabola and
the direction in which it opens.
The value of c determines
whether the parabola will shift up or down. Lastly, the value of b determines whether the graph will shift to the left or
right.