

![]()
Department
ofMathematicsEducation
J. Wilson, EMAT 6680
Matthew Tanner
EMAT 6680
Write-up #2
June 27, 2003
A quadratic function is given the general form.
f(x)=ax2
+ bx + c.
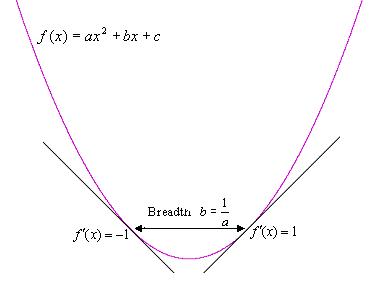
Varying each of the constants a, b, and c, while holding the remaining two constant illustrates their effect on the value of the function.
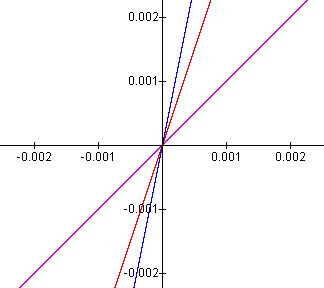
Varying the coefficient a has the effect of varying the breadth of the graph of the function. Let p1 and p2 be the values of x where the slope of the function is –1 and 1 respectively. That is, f’(p1)=-1 and f’(p2)=1. These are two arbitrarily chosen but easily recognizable landmarks on any graph of a quadratic function.

![]()
Since
and
![]() .
.
The distance between p1 and p2 is
![]() .
.
This can further be demonstrated by observing that since the second derivative the quadratic function is everywhere
![]()
the breath is
![]() .
.
It is clear that the breadth of the graph of a quadratic as defined above is characterized by a alone. The effect of the coefficient b is small when x is large.

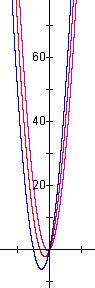
However, proximal to the Y-axis, b plays a larger role. The coefficient b describes the slope of the quadratic function at the Y-axis.

Because the coefficient b does not affect the breadth of the graph but does dictate the slope at the Y-axis intersection, taken together, the effect can be seen as constraining the graph to shift along a parabolic path.
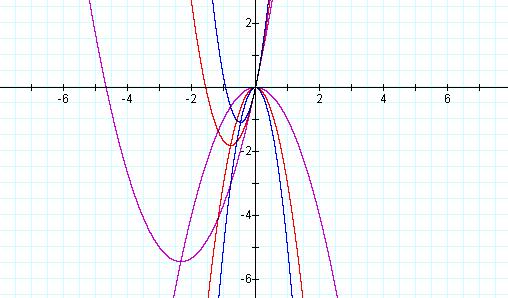
Clickhe graph above for the demo
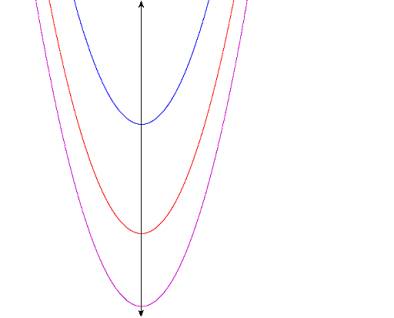
The c-coordinate has the simple effect of shifting the graph of the function along the Y-axis.
It is interesting to note the effect laterally shifting the graph of the function hason the c -coordinate. Consider the graph of the function
![]() .
.
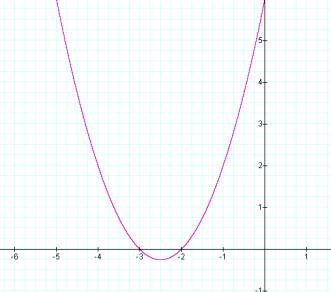
![]()
The function has real roots at–3 and -2 as can be seen in the factorization f(x) = (x+3)(x+2). The slope of the function at x=0 is 5 as the b-coefficient indicates and the Y-intercept is 6 . Now additionally consider the function
![]()
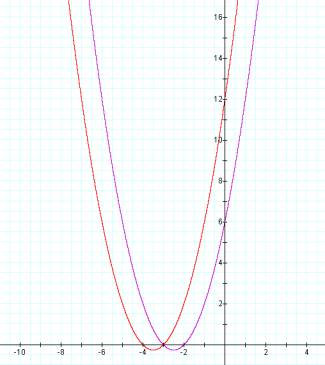
![]()
![]()
The new function has the same breath
(second derivative) as the original function and real roots at –4 and –3 so the
effect has been to shift the graph of the original function to the left. Also note that the new function has a slope
of 7 at the Y-axis and Y-intercept of 12.
The difference in c-coefficients corresponds to the difference of
the Y-intercept of the original function and the value of the original function
evaluated for the value of the first derivative corresponding to the slope at
the Y-axis of the new function. It is evident
that the lateral transformation can be thought of as a composition of the
transformation brought about by a change in the b-coefficient and the
vertical transformation brought about by a change in the c-coefficient.