
Graphs in the xb plane
by: Stephen Bismarck
Consider the equation
 Now graph this relation in the xb plane.
Well to graph this on the xb plane
we need to substitute y in for b, because graphing software will
graph they xb plane but can graph the xy plane. So every place
that you see y just think of it as b in the equation:
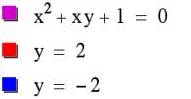
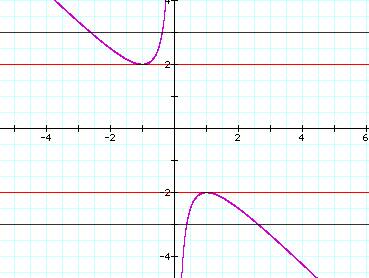
 This is the graph of
  As you can see from the graph there is at least one solution for
 This can be shown easily by substituting
2 and 2 in for y to get
This can be shown easily by substituting
2 and 2 in for y to get
 and
and  All you have to do is solve each equation
and find that you get a double root x = -1 forand
a double root x = 1 for
All you have to do is solve each equation
and find that you get a double root x = -1 forand
a double root x = 1 for
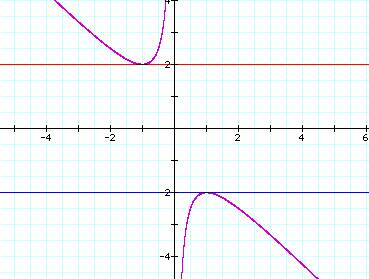
So there is no solution for when y is between
2 and 2 and there are two solutions for when y is greater
then 2 and less than 2.
Now lets investigate changing the 1 in the
equation Lets first try the values 3,
-2, -1, 0, 1, 2, 3 and see what happens.
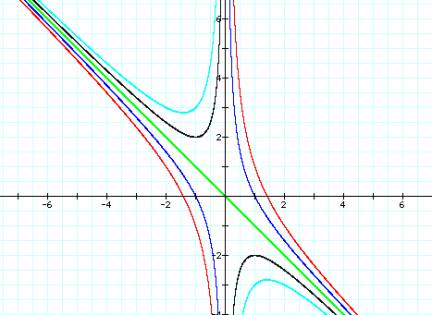
It looks like all of these graphs are bounded
by 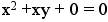 and the y axis, so lets take the
x and y axis away from this picture and see what happens.
and the y axis, so lets take the
x and y axis away from this picture and see what happens.
As you can see the y-axis was just hiding the
other piece of the graph
As you can see by this 3-D graph, the graph is bounded between the green function which
are planes representing in 3-D
is bounded between the green function which
are planes representing in 3-D
Return