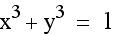
The equation
 describes a circle with
the center at the origin (0,0) and a radius
of 1. describes a circle with
the center at the origin (0,0) and a radius
of 1.
describes a circle with
the center at the origin (0,0) and a radius
of 1. describes a circle with
the center at the origin (0,0) and a radius
of 1.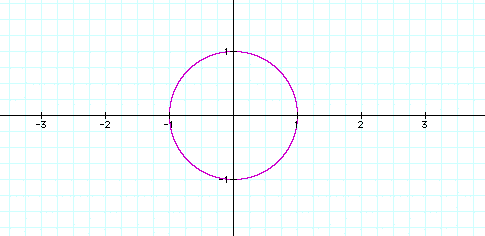
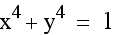
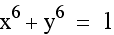
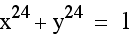
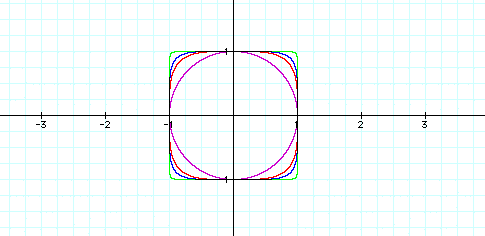
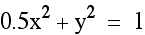
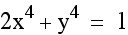
Above, x and y are raised to a small even power. Now we will look at the graph when x and y are raised to a higher even power. Notice that the circle begins to transform into a square. Also, as the powers increase, the figure becomes more square like and the edges are more pointed.

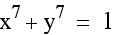
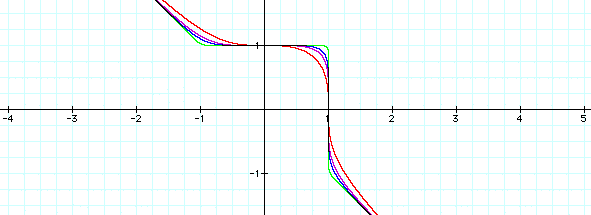
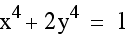
What happens when the x and y are raised to
an odd power such as  ?
The graph appears to be a line with one corner of the square.
?
The graph appears to be a line with one corner of the square.
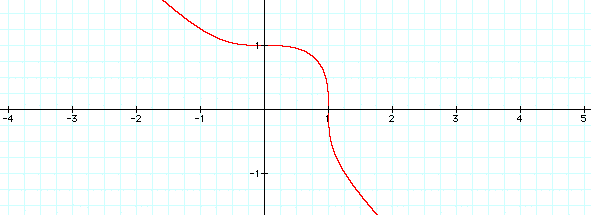
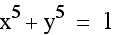
Look at the graph when x and y are raised to a higher odd power. The corner of the square appears to become more pointed and the line approaches y=-x as x and y increase.
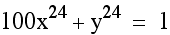
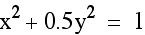
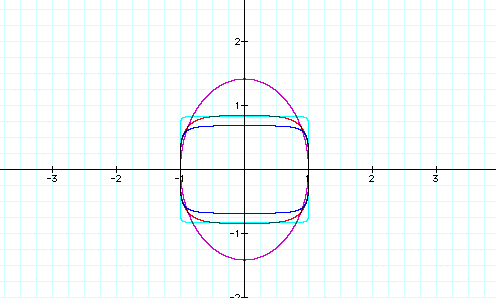
Now look at the graph when you add a coefficient
for x into the equation. The equation 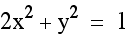 appears to be an ellipse.
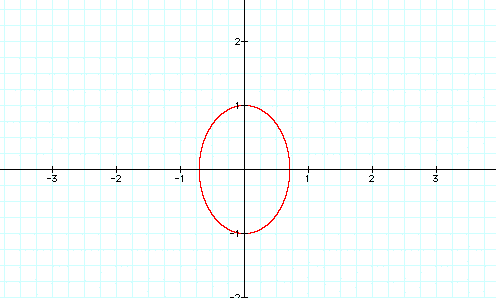
Look at the graph when the coefficient of x is increased and decreased. As the coefficient decreases, the figure resembles an ellipse. As the coefficient increases, the figure becomes more rectangular shaped. Notice that the height and the center of the shape remain unaffected in all of the equations...only the width changes.
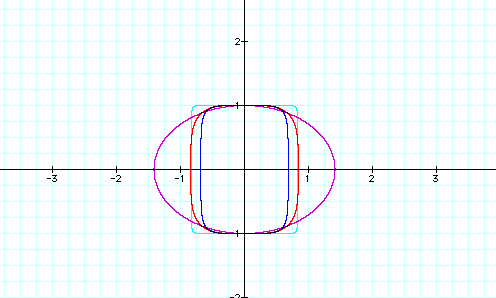
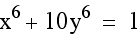
Now look at the graph when you add a coefficient for y into the equation. Similar to altering the coefficient of x from above, as the coefficient of y decreases, the figure resembles an ellipse. As the coefficient increases, the figure becomes more rectangular shaped. However, the width and center of the shape now remain unaffected...only the height changes.
Given the equation 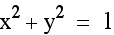 , we saw that the graph was a circle
with center (0,0) and a radius of 1. By raising the x and y to
a larger even power we noticed that the figure becomes a square
with more pointed edges. By raising the x and y to an odd power,
we noticed that the figure appears to be a line and one corner
of a square. As the odd powers of x and y increase the corner
becomes more pointed and the line approaches y=-x. We then looked
at the graph when you add coefficients for x and y. If we increase
or decrease the coefficient of x, the width changes...the height
and center of the shaped remain unaffected. If we increase or
decrease the coefficient of y, the height changes...the width
and center of the shape remains the same.
, we saw that the graph was a circle
with center (0,0) and a radius of 1. By raising the x and y to
a larger even power we noticed that the figure becomes a square
with more pointed edges. By raising the x and y to an odd power,
we noticed that the figure appears to be a line and one corner
of a square. As the odd powers of x and y increase the corner
becomes more pointed and the line approaches y=-x. We then looked
at the graph when you add coefficients for x and y. If we increase
or decrease the coefficient of x, the width changes...the height
and center of the shaped remain unaffected. If we increase or
decrease the coefficient of y, the height changes...the width
and center of the shape remains the same.