Using parametric equations
to generate linear equations.
Write-up by
Blair T. Dietrich
EMAT 6680
Assignment #10 Problems #5 & 7
This investigation will focus on the use of parametric equations to generate linear equations.
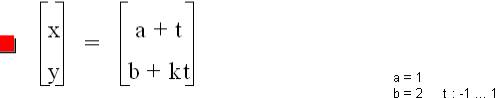
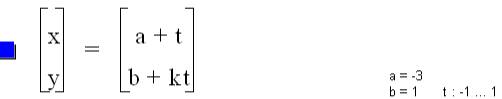
What type of graph does the pair of parametric equations ![]() and
and ![]() yield? To investigate this question the equations
were graphed for a range of values for k for each selected pair of
values for a and b. Some
examples follow:
yield? To investigate this question the equations
were graphed for a range of values for k for each selected pair of
values for a and b. Some
examples follow:
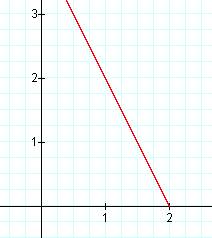
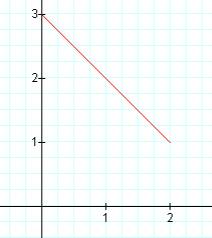
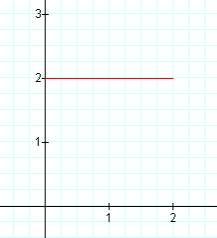
k = -2 k = -1 k = 0
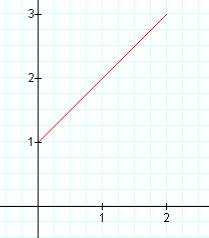
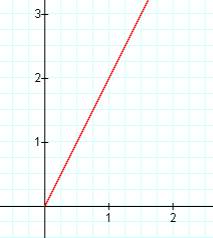
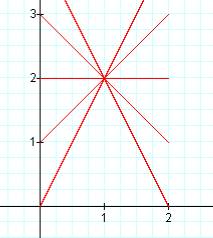
k = 1 k = 2 k=-2,-1,0,1,2 all superimposed
In this case, a segment of a line is "captured" between the vertical lines x = 0 and x = 2. As k is changed, the slope of the line segment changes. In fact, the slope of the line segment equals the value of k. Also, each of these line segments has a common point of (1,2). This point seems to be a "pivot" point for the segment as k (the slope) is varied.
Try animating "k" on the GCF file here.
Similarly…
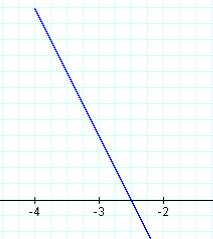
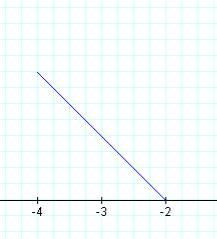
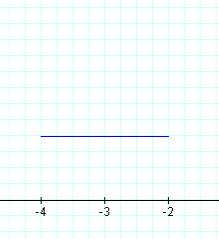
k = -2 k = -1 k = 0
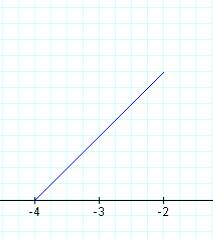
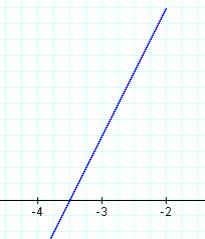
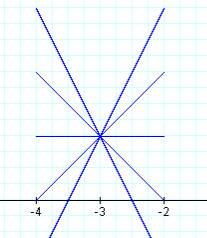
k = 1 k = 2 k=-2,-1,0,1,2 all superimposed
In this case, a segment of a line is "captured" between the vertical lines x = -4 and x = -2. As k is changed, the slope of the line segment changes. In fact, the slope of the line segment equals the value of k. Also, each of these line segments has a common point of (-3,1). This point seems to be a "pivot" point for the segment as k (the slope) is varied.
Try animating "k" on the GCF file here.
It appears that a and b yield the coordinates
of the pivot point. This point is the
point translated from (0,0) in the equation ![]() where k is the
slope of the line. This can be shown by
solving the equation
where k is the
slope of the line. This can be shown by
solving the equation ![]() for t and
substituting into the other equation:
for t and
substituting into the other equation:
This equation is clearly the equation ![]() that has been translated
horizontally a units and vertically b units.
that has been translated
horizontally a units and vertically b units.
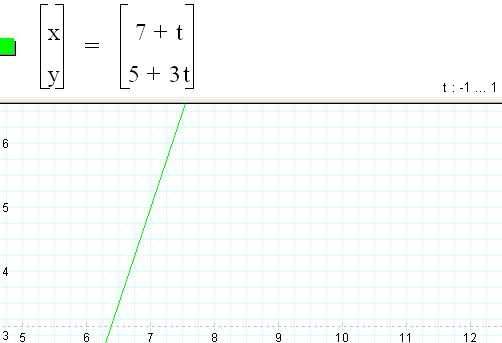
With this in mind, it seems clear that in order to graph the line segment through (7,5) with a slope of 3, the parametric equations needed would be the following: