
David Drew
Assignment 1: “Explorations with ![]() ”
”
EMAT 6680, J. Wilson
We will look at the
relationship of x and y in the equations that follow the pattern of
![]()
Here’s the first case where n
= 1. So the equation is x + y = 1.
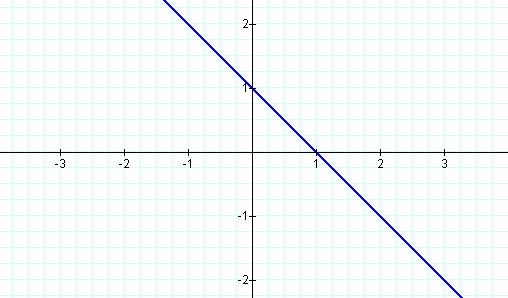
Here is the simplest case. N
is 1 for the equation and we can see that the line is straight. It crosses the
x-axis at 1 and the y-axis at 1 also. We can also see a perfect negative
correlation between the two variables. As one goes up the other goes down the same
value.
Now let’s look at the next
value of n. ![]() .
.
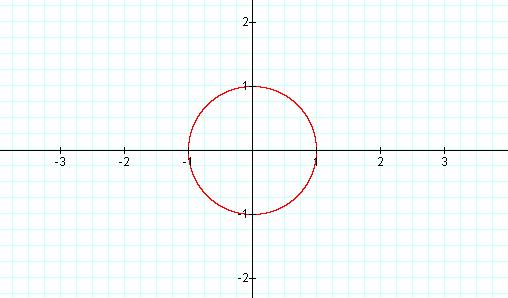
As the graph shows we have
produced a very famous circle. The Unit Circle has
many significant qualities in geometry and trigonometry. But for our
explorations we can see that the circle has a radius of 1 and the center is the
origin. We note here that when n was 1 it was a straight line that never
connected itself. Here, with n = 2 we have a connection in a perfect circle.
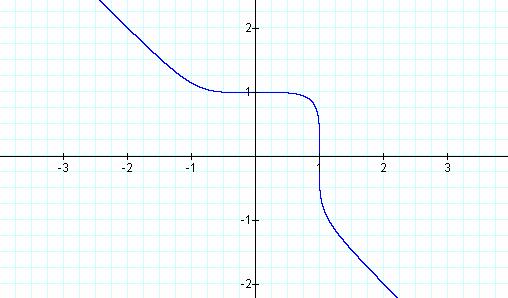
Let’s pursue the next value of n.
Here is ![]() .
.
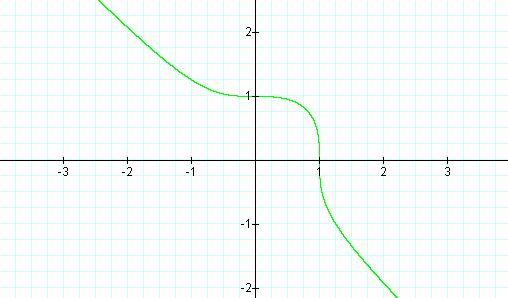
The graph of n = 3 has an
interesting quality. We see some sort of combination of the two previous
graphs. We have a straight line, but we also have an anomaly between y = 1,-1.
We still have a negative correlation with x and y everywhere else outside of y
= 1, -1. But inside the section we have a partial square with a rounded edge.
So to summarize when n equaled 1 and 3 we had some sort of line that had no
end, and when n = 2 we had a line that connected the beginning to the end in a
circular shape.
Next we see the graph when n
is 4. ![]()
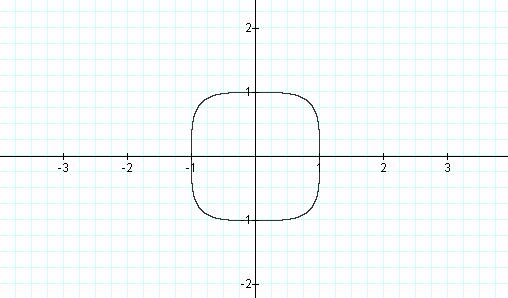
This graph when n = 4 gives
rise to a very interesting observation. So far when n is odd we have seen a
line of some kind extending to infinity in both directions. And when n is even,
such as this, we have a symmetric shape on both the x and the y axis, and the
end of the line connects with the beginning. We’ll continue to increase n.
Here’s the graph of ![]() .
.
Once again we see that n is
odd and it produced a curvy line that extends forever on each side of itself.
We also note that the bend in the line seems to becoming more and more like a
partial square. Our instinct tells us that if we continue to increase n then
the bend in the curve will become more ‘sharp’ at the bend when n is odd. And
the shape created when n is even will actually become a square the higher n
becomes. Let’s just try a few more examples before we conclude.
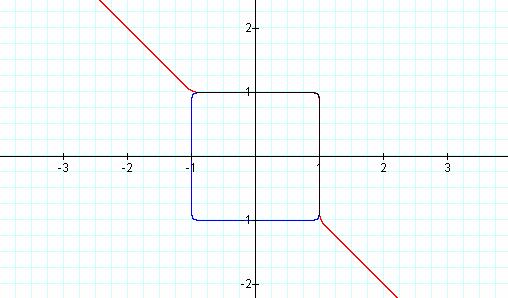
Just to show similarities I
graphed ![]() on the same graph as
on the same graph as ![]() in blue and red respectively. We can see that
the graphs follow the same pattern of a square in the first quadrant. Let’s do
one more with a very large number for n and see how close we can get to a
perfect square. We’ll try
in blue and red respectively. We can see that
the graphs follow the same pattern of a square in the first quadrant. Let’s do
one more with a very large number for n and see how close we can get to a
perfect square. We’ll try ![]() .
.
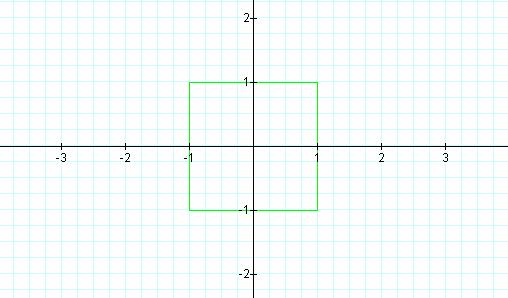
This looks pretty close to
a square to me. The edges are almost parallel to each other and the corners
seem to be perfect right angles, but we know that they are not from our earlier
graphs. The only thing we can say it that this is much more like a square than
any other graph we have produced so far.
Write Up by David Drew