
Assignment 10: The Cycloid
By: David Drew
EMAT 6680, J. Wilson
An old Cambridge
Mathematician named Godfrey Hardey once claimed, “There is no room in the world
for ugly mathematics.” Although one may question the beauty of math there is definitely
no way of saying that math, for the most part, is not without order and
symmetry. Even the ugly ellipse, which seems to be skewed in several ways, has
a world of congruence’s and order that even the circle can’t compete with. So
if someone told you to make a point on one of your car’s tires and trace its
path what do you think the trace would look like? Would it have any order at
all or would it be a messy trace that a toddler might make? Hopefully we’ll
answer these questions with our old friends Geometer’s Sketch Pad and Graphing
Calculator.
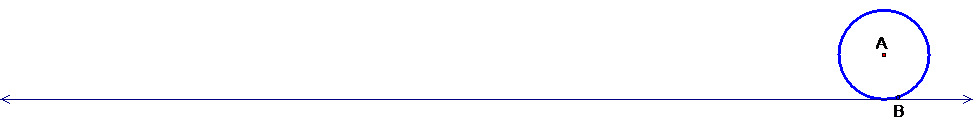
In my mind it’s easiest to
understand if we begin with GSP and show what happens if we trace a random
point on our tire. So pretend that the line is the road and the circle is our
tire then here’s a picture of what the trace point will look like.
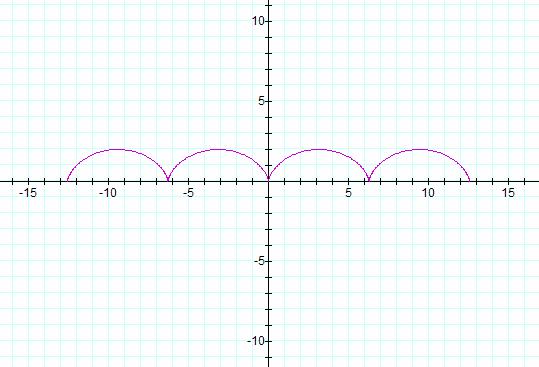
And it seems to have at least
some symmetry, and the humps look like they have an elliptical nature to them.
As A moves down the road at a constant distance from the road B rotates around
the outside of the circle and hits the ground intermittently. But let’s take
this a little further. Since our tire is solid all the way through let’s just
see what happens is two or three other point are somewhere in between A and B.

It looks like as the point
gets closer to our center, A, then the traces begin to become more linear. As
you can see we have less severe peaks and valleys in points C and D. Click on Cycloid to do your own observations on GSP.
As you’ve probably guessed
this construction is called the Cycloid and it’s defined as the locus of a
point at distance y from the centre of a circle of radius a that rolls along a
straight line. If y < a as in our points D and C then it is a curtate
cycloid while if h > a it is a prolate cycloid (we didn’t see a picture of
this). The curve with B at the top has a = h. Now that we know what we’ve
created and what it looks like can we come up with an equation for such a
thing?
It turns out that, with a
little help from our friends at Mathworld, the equation for a Cycloid is x =
a(t – sin(t)) and
y = a(1 – cos(t)). And if we
graph this we can see that it is in fact the same sketch that GSP produced.
The graph runs from ![]() and we need it to go
along this phase because we wanted to see the graph intersect the x axis two
times, and of course a circle doesn’t fully rotate if you multiply pi by odd
numbers. Click on Calculator to view the cycloid
on Graphing Calculator. Just for fun let’s see what happens if you negate the
graph and add it to the original.
and we need it to go
along this phase because we wanted to see the graph intersect the x axis two
times, and of course a circle doesn’t fully rotate if you multiply pi by odd
numbers. Click on Calculator to view the cycloid
on Graphing Calculator. Just for fun let’s see what happens if you negate the
graph and add it to the original.
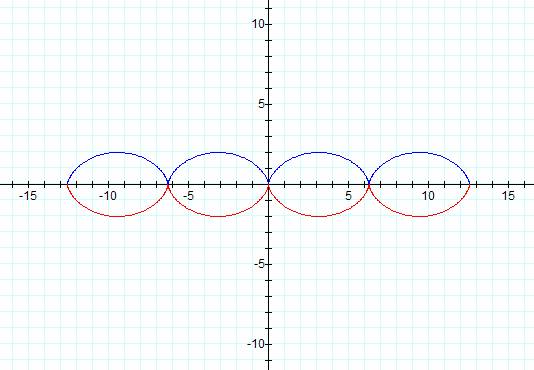
As you can see we’ve added
the values x = -a(t – sin(t)) and y = -a(1 – cos(t)). Of course it’s symmetric
and it looks to be four elliptical shapes line up end to end. If you’re
curious, like I was, you might want to check out what our cycloid looks like
when the z axis is added to the picture. I won’t bore you with an image, but if
you click on Cycloid-3d you can view it for
yourself and experiment.
Write Up by David Drew