
Assignment 12: How good is your Guitar Really?
By: David Drew
EMAT 6680, J. Wilson
Have you ever been playing
your guitar and stopped to wonder why it is shaped like it is? When you started
tuning it have you ever been curious as to why the frets are different lengths
and why they become closer together as you go higher up on the fret board?
Hopefully we can answer some of these questions with a ruler and Excel which we
use to, graph the function for us.
For this discussion I’ll be
using my next door neighbor’s guitar. His name is Taylor Fletcher and he plays
in a band based in
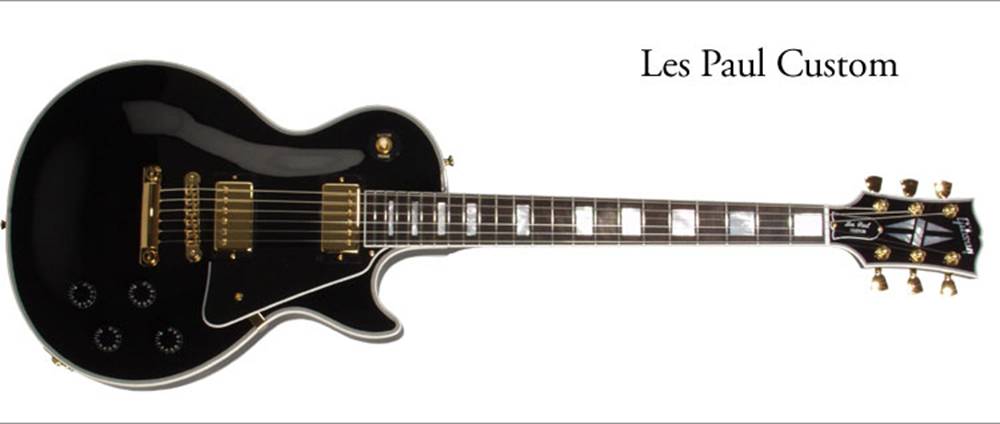
Here’s the method I used to
measure this guitar. Place a ruler at the very edge of the guitar where the
neck meets the fret board. We’ll call this the 0 fret. Measure from the 0 fret
to the bottom side of the last metal bridge, called the 22 fret. Here’s the
numbers that were produced from the Gibson. And here’s the link to the Excel
Spreadsheet. Les Paul
|
Frets |
|
Lengths in Inches |
Ratio |
|
|
0 |
|
17.75 |
0.919014085 |
|
|
1 |
|
16.3125 |
0.921455939 |
|
|
2 |
|
15.03125 |
0.916839917 |
|
|
3 |
|
13.78125 |
0.916099773 |
|
|
4 |
|
12.625 |
0.913366337 |
|
|
5 |
|
11.53125 |
0.910569106 |
|
|
6 |
|
10.5 |
0.907738095 |
|
|
7 |
|
9.53125 |
0.904918033 |
|
|
8 |
|
8.625 |
0.898550725 |
|
|
9 |
|
7.75 |
0.89516129 |
|
|
10 |
|
6.9375 |
0.882882883 |
|
|
11 |
|
6.125 |
0.887755102 |
|
|
12 |
|
5.4375 |
0.873563218 |
|
|
13 |
|
4.75 |
0.855263158 |
|
|
14 |
|
4.0625 |
0.846153846 |
|
|
15 |
|
3.4375 |
0.836363636 |
|
|
16 |
|
2.875 |
0.804347826 |
|
|
17 |
|
2.3125 |
0.783783784 |
|
|
18 |
|
1.8125 |
0.724137931 |
|
|
19 |
|
1.3125 |
0.666666667 |
|
|
20 |
|
0.875 |
0.5 |
|
|
21 |
|
0.4375 |
0 |
|
|
|
|
|
0.807483243 |
Average |
And here’s the chart to give
you an idea of what the relationship is like.
So now that we have a
relationship on our graph, can we create a function that will give us this relationship?
More specifically, is there a formula for the frets of a guitar? Let’s explore
this with our values from our measurements and Graphing Calculator. First we
need to add a graph of the ratios from one fret’s measurement divided by the
measurement of the fret directly above or before it on the fret board.
This graph looks surprisingly
familiar, and it turns out if we graph the function  and restrict it on the interval x = < 0, 21
> then we’ll have a function that resembles our graph in Excel. Here’s a
picture and a Link.
and restrict it on the interval x = < 0, 21
> then we’ll have a function that resembles our graph in Excel. Here’s a
picture and a Link.
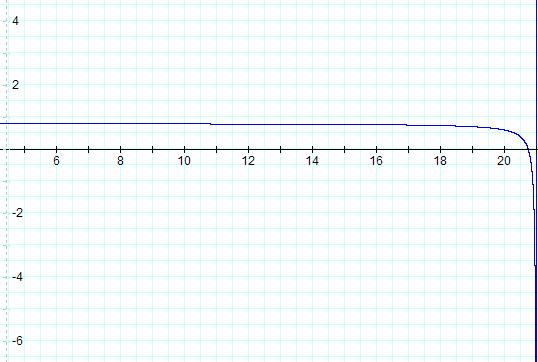
As you can see we have a
“table like” graph from 0 to around 20. But as the frets become smaller and
smaller their ratios begin to drop off the table and go into negative infinity
at a drastic rate. Since we only have 22 frets, the graph will have a limiting
value at 21 with a vertical asymptote at a value of 21, as you can see. This is
true because although there are 22 frets we’ll only have 21 measurements, hence
the limit will be at 21. I came up with this equation by several trial and
error methods. Finally I concluded that we should have a value of 0.01 over the
(x – 21 frets) so that the table wouldn’t drop off too soon. And we used
0.80748 because it was the arithmetic mean.
We do notice that the graph
of the Gibson is a bit wobbly from frets 9 to 18. What does this suggest? I’ll
make a conjecture, but I’m not sure if it is correct because I know very little
about making guitars. The wobbles could indicate a human error in my measurements
or it could indicate that the guitar was made with human hands and hence is
infinitesimally flawed in its construction. Or perhaps, neither one of these
assumptions are true and this is the way that the guitar was supposed to be
created due to the differences in the notes and the abnormalities in the B and
E frets and their relationship with the sharp notes. Since there is no B or E
sharp then there is only a half step from B to C and another half step from E
to F. And in fact these half steps are located at the 7th to 8th
frets, the 12th to 13th fret, and the 19th to
20th frets respectively. And if you look carefully at the Excel
graph of the ratios, you can see the biggest dips come around the 8th,
12th, and 20th frets.
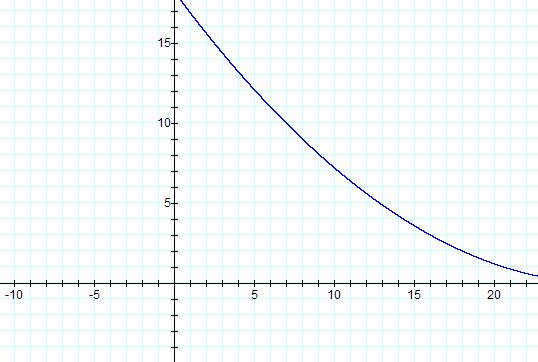
If we go back to our graph
with the lengths of each fret to the end of the fret board can we find function
to match that graph? It looks like it has the properties of a parabola opening
upward. So, again, by trial and error we find that the equation  has the
same rough look as our Excel chart. Here’s a picture and a link.
has the
same rough look as our Excel chart. Here’s a picture and a link.
In conclusion we can say that
there is in fact several different ways to graph the function of a guitar’s
fret board. And I’ve made a few conjectures and assumptions about why there
might be inconsistencies in the graph. If you’re interested in the real art of
making guitars then go to any or all of these sites.
http://www.bourgeoisguitars.com/
http://www.warriorinstruments.com/default2.asp
Write Up by David Drew