
Assignment 2: “Explorations with y = ax2 + bx + c”
By: David Drew
EMAT 6680, J. Wilson
The main question we’re asking here is what happens to the
graph of y = ax2 + bx + c as a is varied where we have b = 1 and c =
2. Let’s first plot the most basic graph of this function where a = 1. So we
have y = x2 + x + 2.
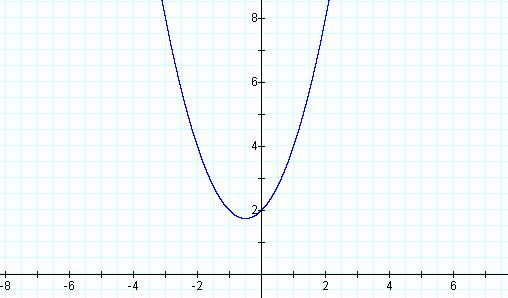
This produces a parabola with
symmetry slightly to the left of x = 0. There is a whole world of study dealing
with the parabola. There are many everyday objects that have parabolic
properties that most people have no idea about. Such objects include
telescopes, and headlights just to name a couple. Visit here
to find out much more. For now let’s just explore the graph’s properties. We’ll
increase a so that the graph reads y = 5x2 + x + 2.
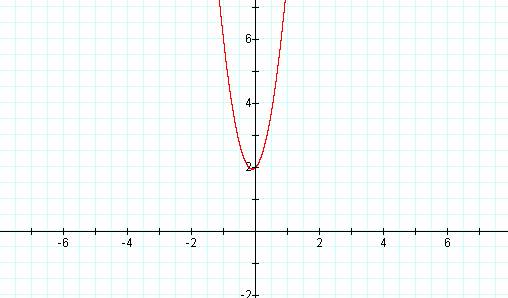
We can see that when we put a
constant greater than one in for a the graph seems to get more narrow. Let’s
increase it a little bit more and see if the same assumption holds true. Here’s
the graph for y = 10x2 + x + 2.
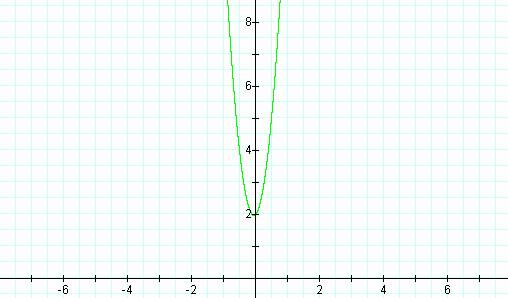
The assumption holds for an
increasing value of a. Can we assume that the graph will stretch out for a
value less than one? Let’s plot the graph y = (1/4)x2 + x + 2.
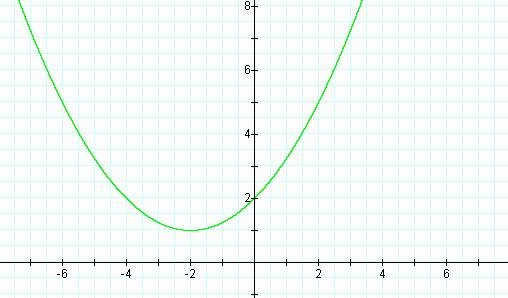
Our guess was right. So we
can say that as we increase the value of a then the graph gets skinny and as we
decrease the value of a then the graph gets fatter. But as we can see if we
graph several functions on the same graph something is similar with all the graphs.
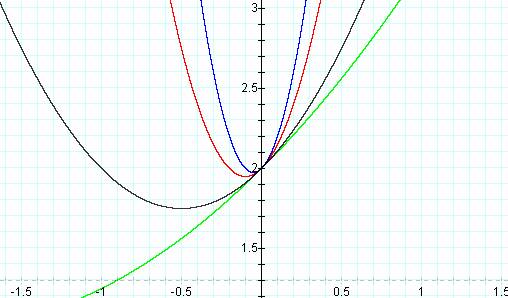
A zoomed in view of all the
graphs shows that each one passes through the point (0, 2). This is due to the
value of the constant c. As long as c does not have a variable of x multiplying
it then any time x = 0 the y value will simply by the constant c. In our case c
= 2, so it should be no surprise that all the graphs pass through (0, 2). Even
when a = 0 we can see that the graph will pass through (0, 2). Here’s the graph
y = (0)x2 + x + 2
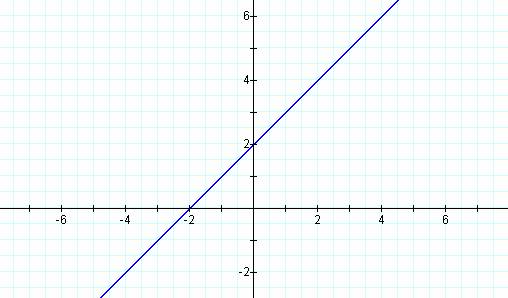
When a = 0 we basically have
a function that says y = x. The only difference is we have added a constant c
so that y = x + c. And whatever c is will be the y intercept, or in other words
where the graph crosses the y axis.
But wait, a new problem has
arisen. What if our constants stay the same and our value of a becomes less
than 0? Will our intercept be the same and will the parabola still be shaped
the way that it has been in the past?
Let’s plug in an arbitrary
negative value for a. Since we started with 1 above then let’s go with a
negative one value. So our equation will read y = -x2 + x + 2.
Here’s the picture.
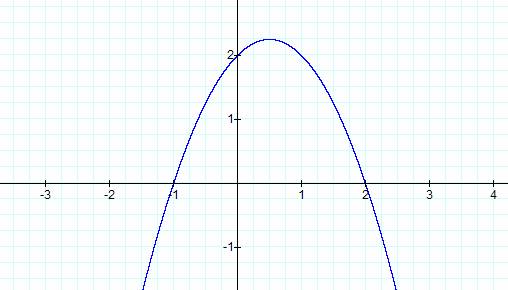
It seems that our graph is
flipped upside down. What does this mean? It really doesn’t mean anything that
we haven’t discovered in the previous examples. The parabola simply opens up
going toward the negatives and it extends into negative infinity. But perhaps
this was a fluke so let’s try a larger value for our negative x. We’ll try y =
-10x2 + x + 2.
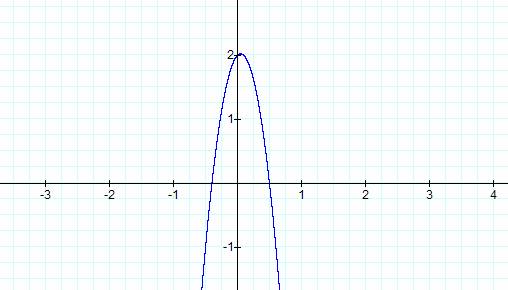
Again we see that the parabola
is shifting down. So our assumption was right that a negative value for x has
the exact opposite effect as our positive value. Here’s a nice picture with
many values of 10 both positive and negative. As an exercise can you verify
which one goes with which value. I’ll give you a head start and tell you what
values I used.
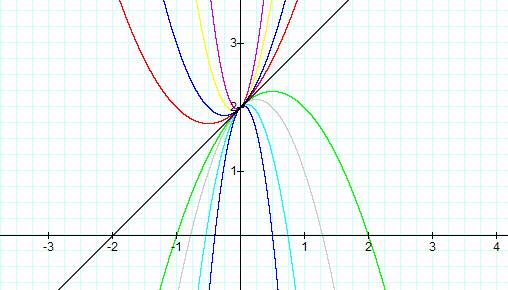
That sure is neat looking. It
almost looks like the graphs dip up and then go back down. But don’t be fooled
all of these graphs only have one dip in them. If they had more than one sign
change then we’d have to have a greater value for the exponent in our first
value of x. Any way in the graph above I used the values -10, 10, 1, -1, -5, 5,
-2, 2, and 0. Can you figure out which of these graphs belong to each value? If
you have Graphing Calculator you can see for yourself. Just click on Graph. You can watch the graph move as the values of n
change. Just hit the play button.
Write Up by David Drew