
Assignment 1
Examining
the Sine Function
By Cara Haskins, Robin
Kirkham, and Matt Tumlin
___________________________________________________________________
We will examine the effect that changing the coefficient values of the sine function have on the graph.
Examine graphs of y = a sin(bx + c) for different values of a, b, and c.
Our first step will be to:
Look at the basic sine graph when a=1, b=1 and c=0
![]()
Notice that the Domain is the set of real numbers, and the Range is [-1,1]. The Period for the sine function is 2p. The graph of
the sine function continues indefinitely.
The amplitude is
the distance from the axis to the highest or lowest point. Or it is half the
distance from the highest to the lowest point. In this case the amplitude is 1.
(Let us use during this example the variable ‘a’ in demonstrating the
amplitude. Currently a=1.)
The period is the
time it takes for the graph to make one complete cycle or in other words, the amount of time it takes for the graph
to begin repeating. Let us
use the variable b in conjunction with adjusting the period. In this case 2p.
In our example, the sine wave
phase is controlled through variable ‘c’ in this first case c=0.
Continue the basic sine graph as our frame of reference.
Let us examine what happens to the graph under the following guidelines.
Step 1: a sin (bx
+c)
Let b=1,c=0, and vary the values of a. Our new equation
becomes y=a sin(x).
Let us use the graphing calculator to examine the effects
of using different values for a, remembering to use positive and negative
values.
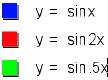
The blue graph is y=sin x. The basic sine graph will always
be in blue in future examples for comparison purposes.
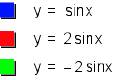
Notice that when the value for variable ‘a’ is positive,
the amplitude increases by a factor of the absolute value of ‘a’, and the graph
emulates the y=sinx original graph as demonstrated above. This is known as a vertical
stretch. Similarly, when ‘a’ is negative, the amplitude is still
increased by a factor of the absolute value of ‘a’.
However, the negative value of ‘a’ causes the graph to be a
reflection across the x-axis.
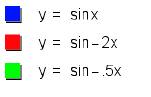
Step 2: Now we are
examining the effects of variable ‘b’.
Let a=1, and c=0 and change the values for b. Our new equation
is now y = sin (bx).
Notice that the amplitude of the graphs does not change
even though the value for b was varied.
When ‘b’ >1, the period of the graph is changed to 2p/b, resulting in a horizontal shrinking of the graph. When
0 < b < 1, then the period is still changed to 2p/b however the graph is now stretched.
This leaves us with the question, what happens when
negative values are substituted for ‘b’?
By substituting negative values for ‘b’, notice there is a reflection across the x-axis for our
two graphs as well as horizontal change of the basic sine graph.
Step 3: Let us
again start with equation y=asin(bx+c) . Let a=1, b=1, and vary c, resulting in
y = sin(x+c)
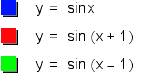
The value of variable “c” moves the sine graph to the right
or the left. When c > 0, the graph moves to the left. When c < 0,the
graph moves to the right.
This horizontal movement is called the phase shift. The phase shift appears to be equal to
the value of “-c”. To be sure, let us check that with a
change to variable “b” simultaneously.
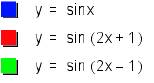
This shows that the phase shift is effected by ‘b’. Thus, the phase shift is actually
‘-c/b’.
In summary, given the equation y = a sin (bx +c) the
following are true:
Changes in the value of ‘a’ effects the altitude of the
sine graph.
Changes in the value of ‘b’ effects the period of the graph.
Changes in the value of ‘c’ effects in conjunction with ‘b’
together effect the phase shift of the graph.