Assignment 10
by
Shridevi kotta
This write up explores the graph of a parametric
curves.
A parametric curve in the plane is a pair of functions
where the two continuous functions
define ordered pairs (x, y). The two equations are usually called the
parametric equations of a curve. The extent of the curve will depend on the
range of t and your work with parametric equations should pay close attention
the range of t. In many applications, we think of x and y "varying with
time t " or the angle of rotation that some line makes from an initial
location.
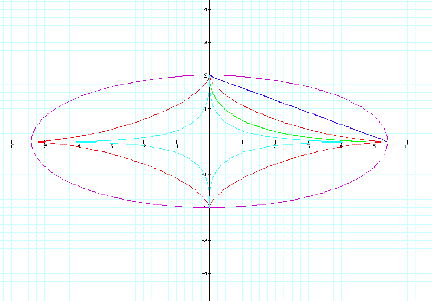
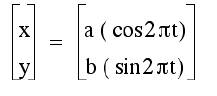
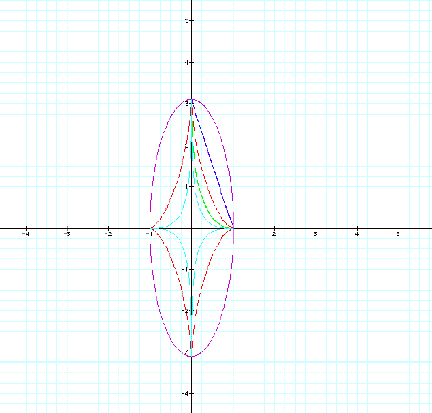
Consider the parametric equations
below:
For a = na =1 the curves are as below. For a =
na taking values between 0 and 5, click the graph below to see the animated
graph.
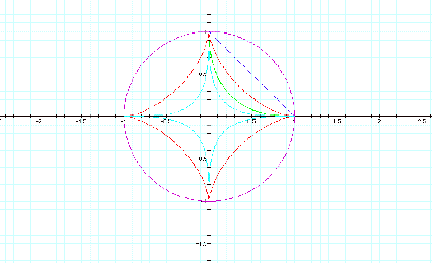
For a < na, the graphs of the above equations
look as below and click on the graph to see the animated graph.
For a > na the graphs of the equations look
like the following. Click on the graph to see the animated version.