
Assignment #2
Investigating
the Graph of the Parabola
y = ax2
+ bx + c
By
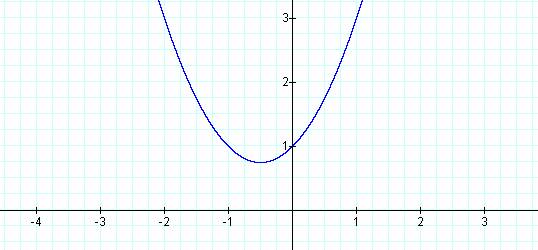
Look at the graph of the parabola: y = ax2 + bx + c
Now look at various values for a in the equation, letting
b and c both equal 1:
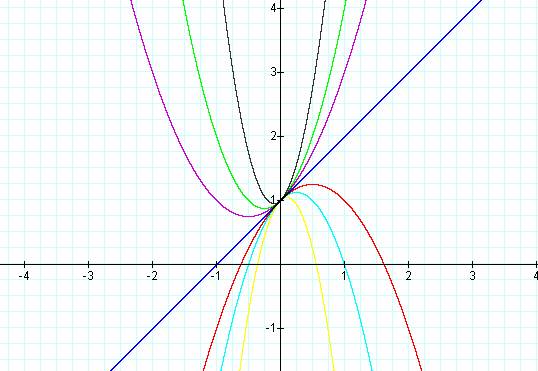
We see that changing the value of a changes the shape of
our parabola.
Various observations can be made about the graph in
relation to a changing a:
· If a is
positive, the graph faces up. If a is
negative, the graph faces downward.
· When a
is small, the parabola is quite fat. The
larger a gets, the skinnier the parabola becomes.
Take a look at the animation of changing a in Graphing
Calculator: click here
(note: you must have Graphing
Calculator to see this function)
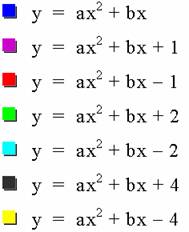
Now varying values of b, while a and c equal 1:
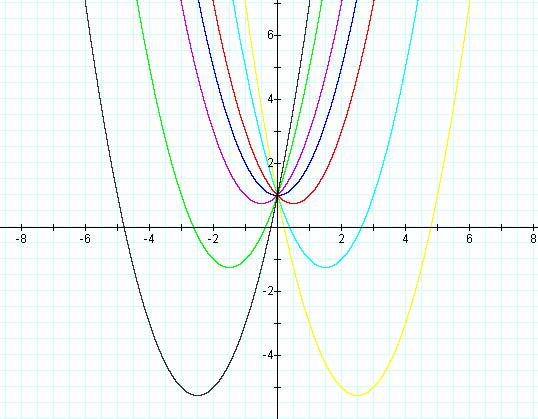
Changing the values of b moves our vertex.
A negative b moves the curve to the right. A positive b moves the curve to the
left.
Take a look at the animation of changing b in Graphing
Calculator: click here
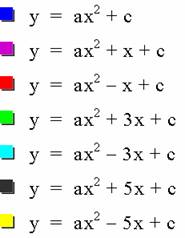
Now as c changes, how the graph changes, variables a and
b both equal 1…
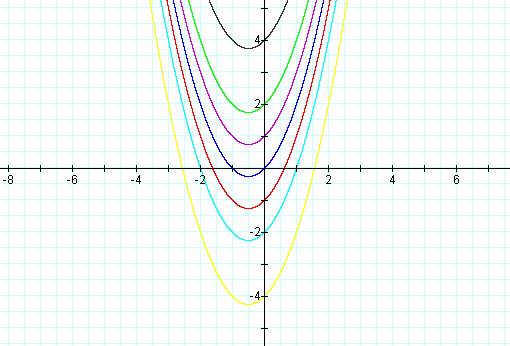
Changing c moves the parabola up or down.
A negative c moves the curve down. A positive c moves the curve up on the
axis.
Take a look at the animation of changing c in Graphing
Calculator: click here